If you have seen a colored scripts like a fish from “Session Snapper v.4” by Tanel Poder or OraLatencyMap by Luca Canali, you may be also want to colorize your scripts.
I’ve created the script for this purposes with a set of predefined substitution variables.
Just download colors.sql and try this script:
@colors.sql;
prompt ::: &_C_RED ***  TEST PASSED  *** &_C_RESET :::
prompt ::: &_C_RED *** &_C_BLINK TEST PASSED &_C_BLINK_OFF *** &_C_RESET :::
You will get something like this: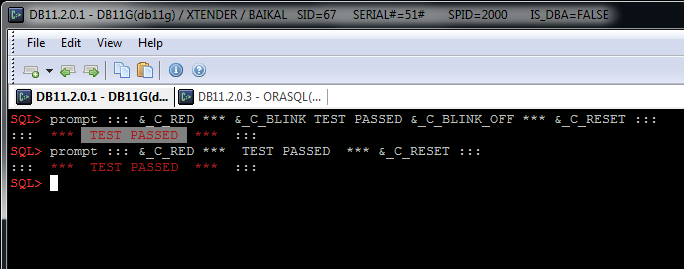
All these variables have a prefix “_C” and “_CB” for background colors.
Do not forget to close text attributes, for example: &_C_BOLD; bold text &_C_BOLD_OFF; enables “bold” attribute and disables it after “bold text”.
Full list of the predefined variables:
Predefined variables
| Description | Variable |
|---|---|
| _C_RESET | Reset formatting – Turn off all attributes |
| _C_BOLD _C_BOLD_OFF |
Set bright mode on/off |
| _C_UNDERLINE _C_UNDERLINE_OFF |
Set underline mode on/off |
| _C_BLINK _C_BLINK_OFF |
Set blink mode on/off |
| _C_REVERSE _C_REVERSE_OFF |
Exchange foreground and background colors |
| _C_HIDE _C_HIDE_OFF |
Hide text (foreground color would be the same as background) |
| _C_BLACK _C_RED _C_GREEN _C_YELLOW _C_BLUE _C_MAGENTA _C_CYAN _C_WHITE _C_DEFAULT |
Font colors |
| _CB_BLACK _CB_RED _CB_GREEN _CB_YELLOW _CB_BLUE _CB_MAGENTA _CB_CYAN _CB_WHITE _CB_DEFAULT |
Background colors |
[collapse]
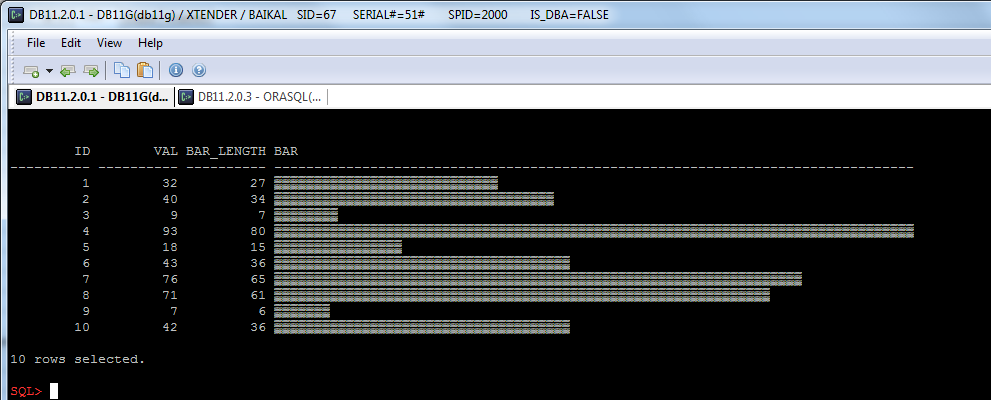
In addition, I want to show a simple example of printing histograms.
We can print a simple histogram using the following query:
-- loading colors variables:
@inc/colors;
-- set max length of bar:
def _max_length=80;
-- columns formatting:
col bar format a&_max_length;
-- clear screen:
prompt &_CLS
with t as (-- it's just a test values for example:
            select level id
                 , round(dbms_random.value(1,100)) val
            from dual
            connect by level<=10
          )
select t.*
      -- bar length is just " (value / max_value) * max_length" in symbols:
      ,floor( val * &_max_length / max(val)over()
            ) as bar_length
      -- generating of bar:
      ,lpad( chr(176)
            ,ceil(val * &_max_length / max(val)over())
            ,chr(192)
           ) as bar
from t;
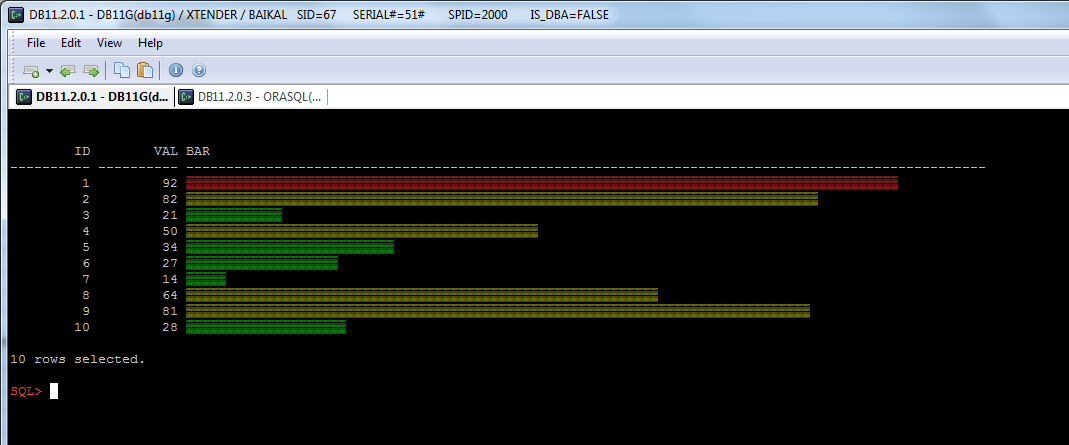
And now we can colorize it:
Colorized script
[sourcecode language="sql"]
-- loading colors variables:
@inc/colors;
-- set max length of bar:
def _max_length=100;
-- column formatting
col bar format a&amp;_max_length;
-- clear screen:
prompt &amp;_CLS
-- test query which prints histogram(or may be simply bars?):
with t as (-- it's just a test values for example:
select level id
, round(dbms_random.value(1,100)) val
from dual
connect by level&lt;=10
)
select
id
,val
, case
when pct &gt;= 0.9 then '&amp;_C_RED'
when pct &lt;= 0.4 then '&amp;_C_GREEN'
else '&amp;_C_YELLOW'
end
-- string generation:
||lpad( chr(192)
,ceil(pct * &amp;_max_length)-9 -- color - 5 chars and reset - 4
,chr(192)
)
||'&amp;_C_RESET'
as bar
from (
select
t.*
,val / max(val)over() as pct -- as a percentage of max value:
from t
) t2
/
[/sourcecode]
[collapse]