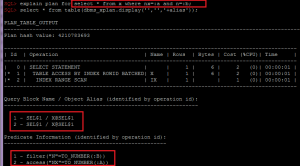
Sometimes it might be useful to analyze top time-consuming filter and access predicates from ASH, especially in cases when db load is spread evenly enough by different queries and top segments do not show anything interesting, except usual things like “some tables are requested more often than others”.
Of course, we can start from analysis of SYS.COL_USAGE$: col_usage.sql
[sourcecode language=”sql”]
col owner format a30
col oname format a30 heading "Object name"
col cname format a30 heading "Column name"
accept owner_mask prompt "Enter owner mask: ";
accept tab_name prompt "Enter tab_name mask: ";
accept col_name prompt "Enter col_name mask: ";
SELECT a.username as owner
,o.name as oname
,c.name as cname
,u.equality_preds as equality_preds
,u.equijoin_preds as equijoin_preds
,u.nonequijoin_preds as nonequijoin_preds
,u.range_preds as range_preds
,u.like_preds as like_preds
,u.null_preds as null_preds
,to_char(u.timestamp, ‘yyyy-mm-dd hh24:mi:ss’) when
FROM
sys.col_usage$ u
, sys.obj$ o
, sys.col$ c
, all_users a
WHERE a.user_id = o.owner#
AND u.obj# = o.obj#
AND u.obj# = c.obj#
AND u.intcol# = c.col#
AND a.username like upper(‘&owner_mask’)
AND o.name like upper(‘&tab_name’)
AND c.name like upper(‘&col_name’)
ORDER BY a.username, o.name, c.name
;
col owner clear;
col oname clear;
col cname clear;
undef tab_name col_name owner_mask;
[/sourcecode]
But it’s not enough, for example it doesn’t show predicates combinations. In this case we can use v$active_session_history and v$sql_plan:
[sourcecode language=”sql”]
with
ash as (
select
sql_id
,plan_hash_value
,table_name
,alias
,ACCESS_PREDICATES
,FILTER_PREDICATES
,count(*) cnt
from (
select
h.sql_id
,h.SQL_PLAN_HASH_VALUE plan_hash_value
,decode(p.OPERATION
,’TABLE ACCESS’,p.OBJECT_OWNER||’.’||p.OBJECT_NAME
,(select i.TABLE_OWNER||’.’||i.TABLE_NAME from dba_indexes i where i.OWNER=p.OBJECT_OWNER and i.index_name=p.OBJECT_NAME)
) table_name
,OBJECT_ALIAS ALIAS
,p.ACCESS_PREDICATES
,p.FILTER_PREDICATES
— поля, которые могут быть полезны для анализа в других разрезах:
— ,h.sql_plan_operation
— ,h.sql_plan_options
— ,decode(h.session_state,’ON CPU’,’ON CPU’,h.event) event
— ,h.current_obj#
from v$active_session_history h
,v$sql_plan p
where h.sql_opname=’SELECT’
and h.IN_SQL_EXECUTION=’Y’
and h.sql_plan_operation in (‘INDEX’,’TABLE ACCESS’)
and p.SQL_ID = h.sql_id
and p.CHILD_NUMBER = h.SQL_CHILD_NUMBER
and p.ID = h.SQL_PLAN_LINE_ID
— если захотим за последние 3 часа:
— and h.sample_time >= systimestamp – interval ‘3’ hour
)
— если захотим анализируем предикаты только одной таблицы:
— where table_name=’&OWNER.&TABNAME’
group by
sql_id
,plan_hash_value
,table_name
,alias
,ACCESS_PREDICATES
,FILTER_PREDICATES
)
,agg_by_alias as (
select
table_name
,regexp_substr(ALIAS,’^[^@]+’) ALIAS
,listagg(ACCESS_PREDICATES,’ ‘) within group(order by ACCESS_PREDICATES) ACCESS_PREDICATES
,listagg(FILTER_PREDICATES,’ ‘) within group(order by FILTER_PREDICATES) FILTER_PREDICATES
,sum(cnt) cnt
from ash
group by
sql_id
,plan_hash_value
,table_name
,alias
)
,agg as (
select
table_name
,’ALIAS’ alias
,replace(access_predicates,’"’||alias||’".’,’"ALIAS".’) access_predicates
,replace(filter_predicates,’"’||alias||’".’,’"ALIAS".’) filter_predicates
,sum(cnt) cnt
from agg_by_alias
group by
table_name
,replace(access_predicates,’"’||alias||’".’,’"ALIAS".’)
,replace(filter_predicates,’"’||alias||’".’,’"ALIAS".’)
)
,cols as (
select
table_name
,cols
,access_predicates
,filter_predicates
,sum(cnt)over(partition by table_name,cols) total_by_cols
,cnt
from agg
,xmltable(
‘string-join(for $c in /ROWSET/ROW/COL order by $c return $c,",")’
passing
xmltype(
cursor(
(select distinct
nvl(
regexp_substr(
access_predicates||’ ‘||filter_predicates
,'("’||alias||’"\.|[^.]|^)"([A-Z0-9#_$]+)"([^.]|$)’
,1
,level
,’i’,2
),’ ‘)
col
from dual
connect by
level<=regexp_count(
access_predicates||’ ‘||filter_predicates
,'("’||alias||’"\.|[^.]|^)"([A-Z0-9#_$]+)"([^.]|$)’
)
)
))
columns cols varchar2(400) path ‘.’
)(+)
order by total_by_cols desc, table_name, cnt desc
)
select
table_name
,cols
,sum(cnt)over(partition by table_name,cols) total_by_cols
,access_predicates
,filter_predicates
,cnt
from cols
where rownum<=50
order by total_by_cols desc, table_name, cnt desc;
[/sourcecode]
As you can see it shows top 50 predicates and their columns for last 3 hours. Despite the fact that ASH stores just sampled data, its results are representative enough for high-load databases.
Just few details:
- Column “COLS” shows “search columns”, and total_by_cols – their number of occurrences
- I think it’s obvious, that this info is not unambiguous marker of the problem, because for example few full table scans can misrepresent the statistics, so sometimes you will need to analyze such queries deeper (v$sqlstats,dba_hist_sqlstat)
- We need to group data by OBJECT_ALIAS within SQL_ID and plan_hash_value, because in case of index access with lookup to table(“table access by rowid”) some predicates are in the row with index access and others are in the row with table access.

Depending on the needs, we can modify this query to analyze ASH data by different dimensions, for example with additional analysis of partitioning or wait events.
