
Oracle diagnostic events is a great feature, but unfortunately poorly documented and nonintuitive, so it’s difficult to remember all events/actions/parameters and even read its internal documentation using oradebug. So I decided to compile its internal doc as a more convenient html-version (https://orasql.org/files/events/) and make a cheat sheet of some unknown or little-known use cases.
Example 1:
alter system set events
   'kg_event[1476]
        {occurence: start_after 1, end_after 3}
            trace("stack is: %\n", shortstack())
            errorstack(2)
    ';
- kg_event[errno] – Kernel Generic event in library Generic for error number events, which instructs to trace ORA-errno errors;
- {occurence: start_after X, end_after Y} – is a filter, which instructs to skip X event checks and trace just Y times;
- trace(format, str1, str2, …, str15) – is a function from ACTIONS for printing into a trace file;
- shortstack() – is a function from ACTIONS , which returns a short call stack as a string;
- errorstack(level) – is a function from ACTIONS, which prints extended info (level: 0 – errorstack only, 1 – errorstack + call stack, 2 – as level 1 + processtate, 3 – as level 2 + context area). You can get more details with PROCESSSTATE or SYSTEMSTATE. If you need just a call stack, you can use CALLSTACK(level) , with function arguments in case of level>1.
Example 2:
alter system set events
    'trace[SQL_Compiler.* | SQL_Execution.*]
        [SQL: ...]
            {process: ospid = ...}
            {occurence:end_after 3}
                controlc_signal()';
- trace[component] – is the main diagnostic event, which allows to specify Components to trace. This command shows how to specify all child components of SQL_Compiler and SQL_Execution.
- SQL[SQL: sqlid ] – is the only SCOPE in library RDBMS, which allows to trace specific SQL_ID and all its recursive calls (or for example, if you specify sql_id of a PL/SQL call, then all its internal queries will be traced too);
- {process: …} – is a filter, which allows to filter processes;
- controlc_signal – is an ACTION, that raises “ORA-01013: user requested cancel of current operation”, ie it’s like this session interrupted own call.
I’ve used this command recently when I had to help developers to find where some suboptimal and unnecessary queries, discovered during performance load testing, come from their code (huge webapp with hibernate).
Example 3:
alter system set events
    'sql_trace {process: ospid = ...}
     trace("sqlid(%): %\n", sqlid(), evfunc())
     ';
sql_trace – is just a good old trace event #10046, and this function forces oracle to print a function name and sql_id for each sql_trace event. Simple example:

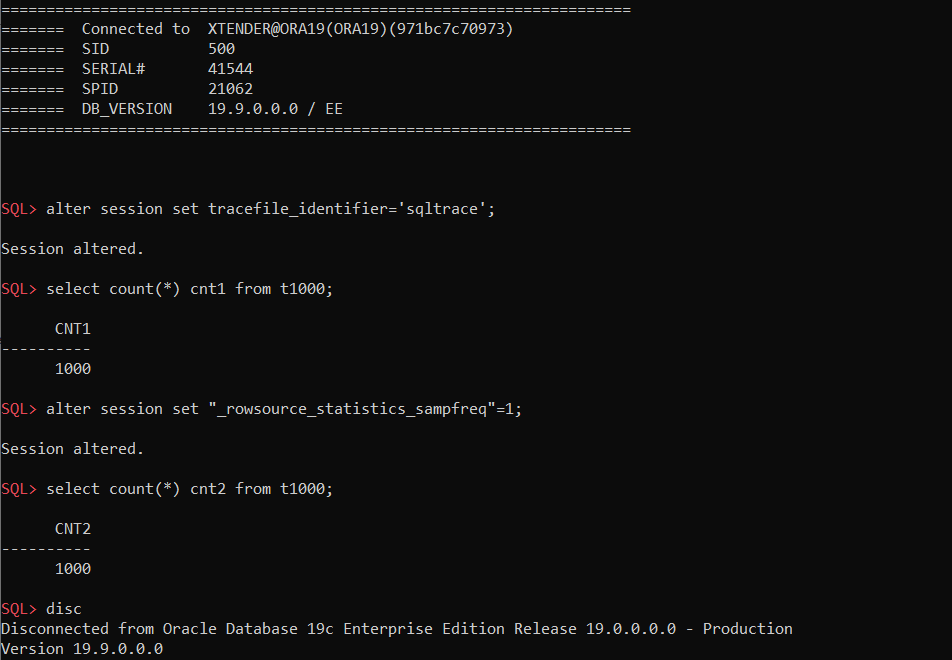
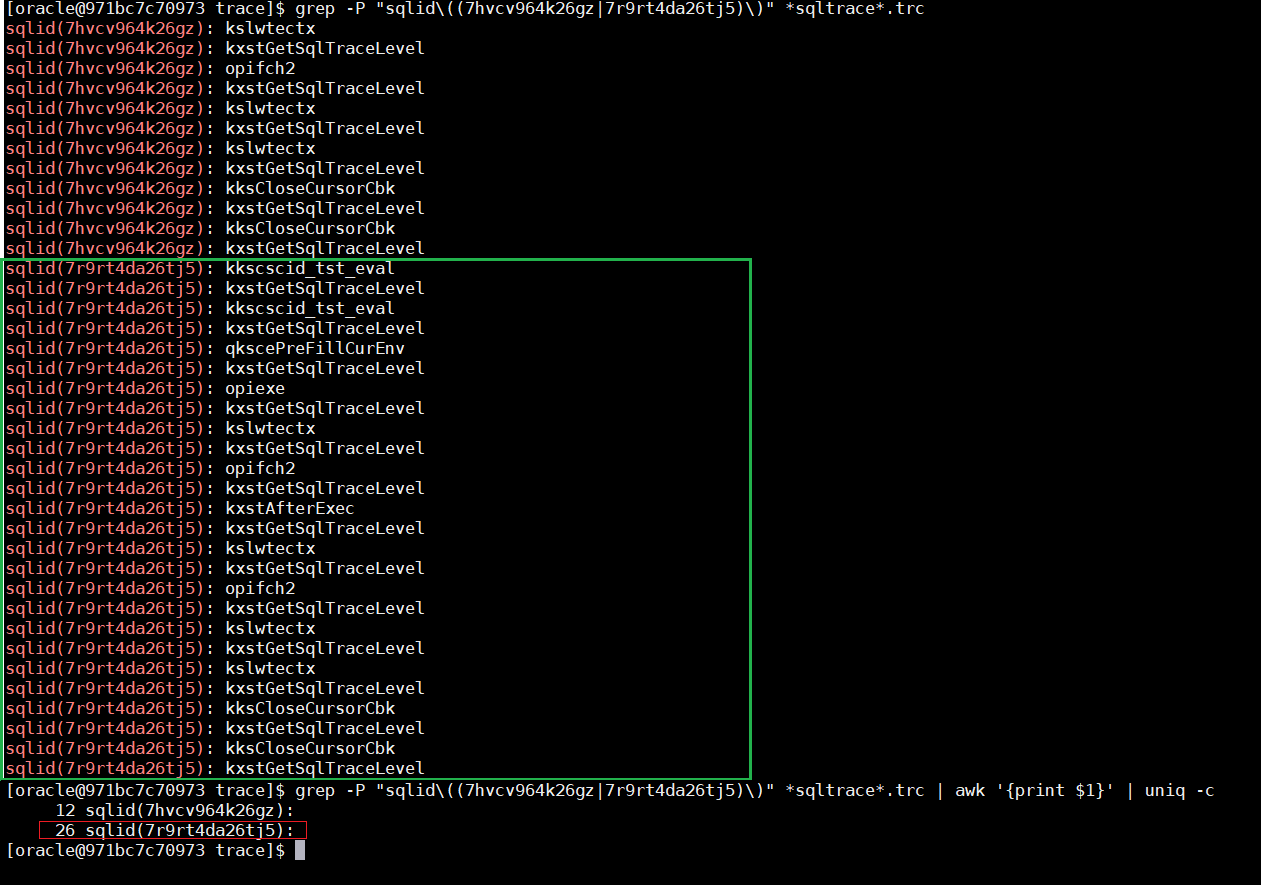
As you can see we get 26 “occurrences” in case of “_rowsource_statistics_sampfreq”=1 instead just 12 by default. More details about this here: https://alexanderanokhin.com/2012/12/24/timing-rowsource-statistics-part-2-overhead-and-inconsistent-time/
Example 4:
alter system set events
    'wait_event["enq: TM - contention"]
        {wait: minwait=1000}
            errorstack(1)
            trace("event=[%] sqlid=%, ela=% p1=% p2=% p3=%\n",
                   evargs(5), sqlid(), evargn(1), evargn(2), evargn(3), evargn(4))
    ';
- wait_event[name] – event to control wait event post-wakeup actions, first argument is a wait event name, all wait event names and their parameters (P1,P2,P3) you can find in v$event_name:
select
   wait_class,name
  ,parameter1,parameter2,parameter3
  ,display_name
from v$event_name;
- {wait: … } – is a filter that allows to specify both the minimum wait time(ms) and parameters P1, P2, P3. For example, for this “TM-contention” wait event, P2 is “object #”, and we can specify {wait: minwait=1000; p2=12345}, ie only table TM-lock wait events on the table with object_id=12345 and longer than 1 sec;
- evargX() – functions from ACTIONs, which return event check arguments values, where 1st argument is an elapsed time(ms), 2nd-4th – parameters p1-p3, and 5th – wait event name. kg_event has own related functions – errargX().
Example 5:
Occasionally, it may be useful to investigate which session variables have been altered. Consider the case where someone forgot to specify nls parameters in to_number() and didn’t specify "on conversion error" clause, and some session sporadically get “ORA-01722: invalid number”:
-- original parameters:
SQL> alter session set nls_numeric_characters='.,';

Session altered.

-- all works fine...
SQL> select to_number('1,200.3','999g999d999') + 10 from dual;

TO_NUMBER('1,200.3','999G999D999')+10
-------------------------------------
                               1210.3

-- until they've been changed at some point:
SQL> alter session set nls_numeric_characters=".'";

Session altered.

-- obviously we get errors:
SQL> select to_number('1,200.3','999g999d999') + 10 from dual;
select to_number('1,200.3','999g999d999') + 10 from dual
                 *
ERROR at line 1:
ORA-01722: invalid number
There is no special view for session parameters which are not a part of v$ses_optimizer_env, but we can easily get them using MODIFIED_PARAMETERS():
alter system set events
    'kg_event[1722]
        {process: ospid=27556}
        {occurence:end_after 1}
            MODIFIED_PARAMETERS()';
And since we have v$diag_alert_ext for alert.log and v$diag_trace_file_contents for trace files, we can get them using this simple query:
select c.payload
from v$diag_trace_file_contents c
where 1=1
  and c.session_id   = &sid -- session sid
  and c.serial#      = &serial -- session serial#
  and c.section_name = 'Error Stack' -- they will be in "Error Stack"
--  and c.payload like '%nls_numeric%' -- we can filter only specific nls parameters
  and c.timestamp>systimestamp-interval'15'minute -- last 15 minutes
;

-- Results:
DYNAMICALLY MODIFIED PARAMETERS:
  nls_language             = "AMERICAN"
  nls_territory            = "AMERICA"
  nls_sort                 = "BINARY"
  nls_date_language        = "AMERICAN"
  nls_date_format          = "yyyy-mm-dd hh24:mi:ss"
  nls_currency             = "$"
  nls_numeric_characters   = ".'"
  nls_iso_currency         = "AMERICA"
  nls_calendar             = "GREGORIAN"
  nls_time_format          = "hh24:mi:ssxff"
  nls_timestamp_format     = "yyyy-mm-dd hh24:mi:ssxff"
  nls_time_tz_format       = "hh24:mi:ssxff TZR"
  nls_timestamp_tz_format  = "yyyy-mm-dd hh24:mi:ssxff TZR"
  nls_dual_currency        = "$"
  nls_comp                 = "BINARY"
  local_listener           = ""
Update 1:
I’ve just got a question:
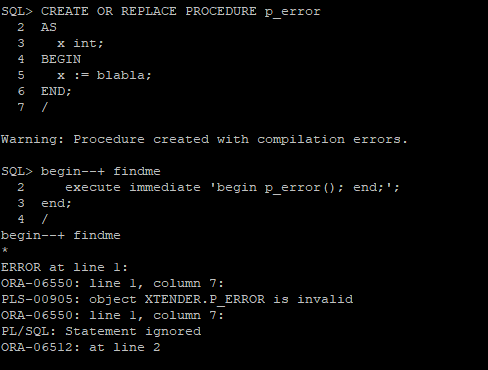
We use “Extensible Optimizer Interface”, i.e. Oracle CBO calls such code internally, which fails periodically with “ORA-06550 PL/SQL compile error“. Can we specify both “kg_event” and “sql_id” so we could get those errors with details in alert.log?
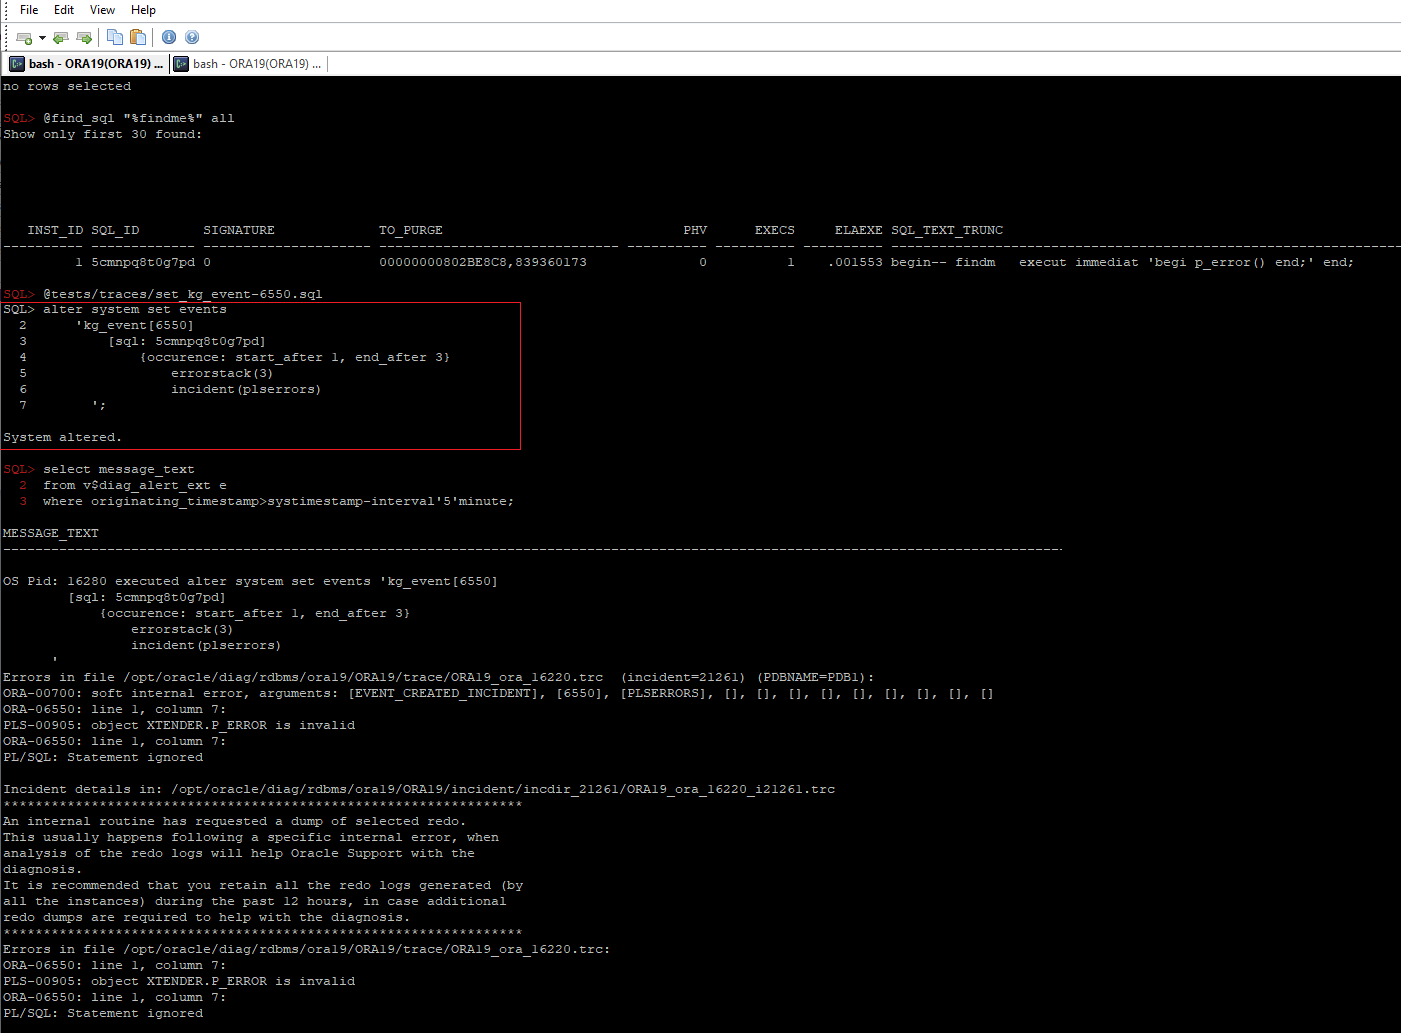
Of course, we can – simple example:
alter system set events
    'kg_event[6550]
        [sql: 5cmnpq8t0g7pd]
            {occurence: start_after 1, end_after 3}
                errorstack(3)
                incident(plserrors)
      ';
As you can see we use incident(label) here to generate an incident file (which you can easily pack and send to Oracle support or consulters) and kg_event[6550] to trace “ORA-06550: line %, column %” errors.
Update 2:
Just link to my another post: Where does the commit or rollback happen in PL/SQL code?
https://orasql.org/2021/09/12/where-does-the-commit-or-rollback-happen-in-pl-sql-code/
Update 3:
Recently in telegram I’ve got a question: how to catch and trace ‘alter table’ operation?
In this case we can find a function that executes alter table on orafun.info (function ‘atb’) and use this function name for a filter {callstack: fprefix ...}, for example:
alter session set events
    'sql_trace {callstack: fprefix atb} {occurence:end_after 1} errorstack(1)';
And you’ll get in the trace file something like this:
dbkedDefDump(): Starting a non-incident diagnostic dump (flags=0x0, level=1, mask=0x0)
----- Error Stack Dump -----
<error barrier> at 0x7ffe52ad1db0 placed dbkda.c@296
----- Current SQL Statement for this session (sql_id=ggx91ms9duqbz) -----
alter table dd add b int
----- PL/SQL Stack -----
----- PL/SQL Call Stack -----
  object      line  object
  handle    number  name
0x7977d758         1  anonymous block

----- Call Stack Trace -----
calling              call     entry                argument values in hex
location             type     point                (? means dubious value)
-------------------- -------- -------------------- ----------------------------
Useful links:
Very useful articles by Tanel Poder:
1. The full power of Oracle’s diagnostic events, part 1: Syntax for KSD debug event handling
2. The full power of Oracle’s diagnostic events, part 2: ORADEBUG DOC and 11g improvements
3. What Caused This Wait Event: Using Oracle’s wait_event[] tracing
4. http://tech.e2sn.com/oracle/troubleshooting/oradebug-doc
Ora C functions on Frits Hoogland’s site: http://orafun.info/
HTML version of the internal oradebug/diagnostic events doc: https://orasql.org/files/events