One of the easiest ways is to use diagnostic events:
alter session set events 'sql_trace {callstack: fname xctend} errorstack(1)';
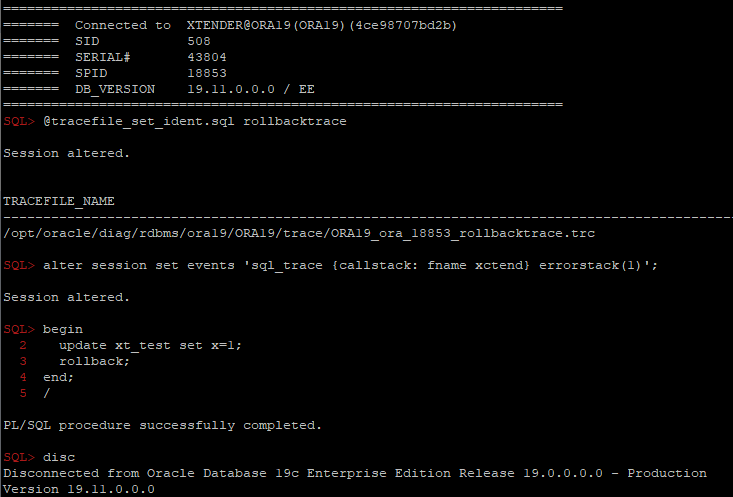
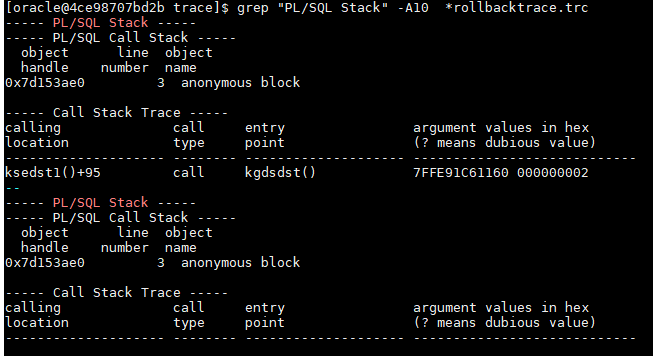
One of the easiest ways is to use diagnostic events:
alter session set events 'sql_trace {callstack: fname xctend} errorstack(1)';


You may know that some applications generate queries with bind variables’ names like :1 or :”1″, and neither SQL*Plus nor SQLCl support such variables:
SQLPlus:
SQL> var 1 number;
SP2-0553: Illegal variable name "1".
SQLCL:
SQL> var 1 number;
ILLEGAL Variable Name "1"
So we can’t run such queries as-is, but, obviously, we can wrap them into anonymous PL/SQL blocks and even create a special script for that:
Continue reading→I know 2 “special” exceptions that can’t be processed in exception handler:
Tanel Poder described the first one (ORA-01013) in details here: https://tanelpoder.com/2010/02/17/how-to-cancel-a-query-running-in-another-session/ where Tanel shows that this error is based on SIGURG signal (kill -URG):
-- 1013 will not be caught:
declare
 e exception;
 pragma exception_init(e,-1013);
begin
  raise e;
exception when others then dbms_output.put_line('caught');
end;
/

declare
*
ERROR at line 1:
ORA-01013: user requested cancel of current operation
ORA-06512: at line 5
Got an interesting question today in RuOUG:
Some very simple PL/SQL procedures usually are completed within ~50ms, but sometimes sporadically longer than a second. For example, the easiest one from these procedures:
create or replace PROCEDURE XXXX (
  P_ORG_NUM IN number,
  p_result OUT varchar2,
  p_seq OUT number
) AS
BEGIN
  p_seq := P_ORG_NUM; p_result:='';
END;
sql_trace shows that it was executed for 1.001sec and all the time was “ON CPU”:
Continue reading→@tracefile_read_last_by_mask filemask [regexp] [ignore_regexp]
– finds last trace by filemask and filters rows by regexp and filters out rows by ignore_regexp:
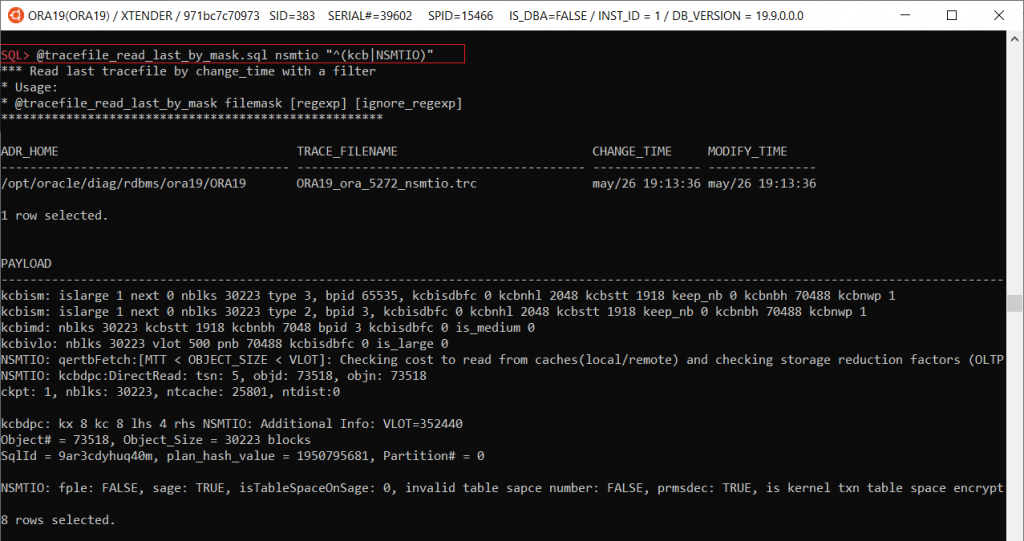
@ tracefile_by_mask.sql [mask] – finds and shows last 10 trace files by mask
Continue reading→Oracle diagnostic events is a great feature, but unfortunately poorly documented and nonintuitive, so it’s difficult to remember all events/actions/parameters and even read its internal documentation using oradebug. So I decided to compile its internal doc as a more convenient html-version (https://orasql.org/files/events/) and make a cheat sheet of some unknown or little-known use cases.
alter system set events
   'kg_event[1476]
        {occurence: start_after 1, end_after 3}
            trace("stack is: %\n", shortstack())
            errorstack(2)
    ';
alter system set events
    'trace[SQL_Compiler.* | SQL_Execution.*]
        [SQL: ...]
            {process: ospid = ...}
            {occurence:end_after 3}
                controlc_signal()';
select title, short_url
from v$blog
where pubDate>=systimestamp - interval '5' month;
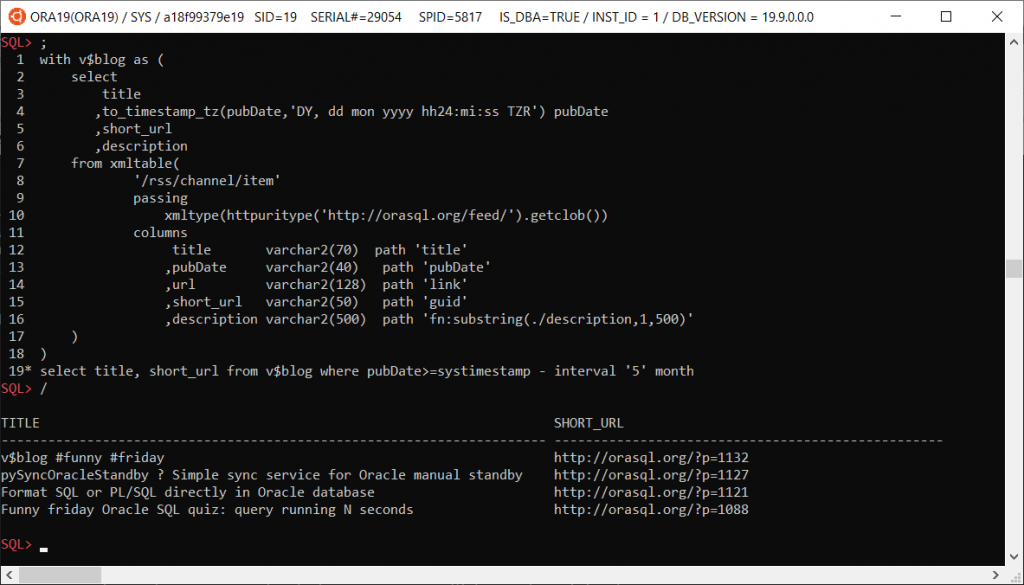
with v$blog as (
    select
        title
       ,to_timestamp_tz(pubDate,'DY, dd mon yyyy hh24:mi:ss TZR') pubDate
       ,short_url
       ,description
    from xmltable(
            '/rss/channel/item'
            passing
                xmltype(httpuritype('https://orasql.org/feed/').getclob())
            columns
                 title       varchar2(70)  path 'title'
                ,pubDate     varchar2(40)   path 'pubDate'
                ,url         varchar2(128)  path 'link'
                ,short_url   varchar2(50)   path 'guid'
                ,description varchar2(500)  path 'fn:substring(./description,1,500)'
    )
)
select title, short_url from v$blog where pubDate>=systimestamp - interval '5' month;
This document is my attempt to bring together the available options that can be used to determine the root cause of an issue in order to create a roadmap to help support engineers narrow down the cause of concern.
It is a living document and will be edited and amended as time goes by. Please do check back again in the future.
Warning: these parameters should only be used in conjunction with an Oracle Support Engineer and are not intended for DBAs to self-triage; also they should not be left set after triage without discussion with an Oracle Support Engineer.
Continue reading→I created this simple service a couple of years ago. It’s pretty simple, small and intuitive Python app, so you can easily modify it to suit your own needs and run on any platform: https://github.com/xtender/pySync
