Oracle SQL
  • LICENSE

Category Archives: diagnostic event 10046

Where does the commit or rollback happen in PL/SQL code?

Posted on September 12, 2021 by Sayan Malakshinov Posted in diagnostic event 10046, oracle, PL/SQL, trace, troubleshooting, undocumented 2,181 Page views 1 Comment

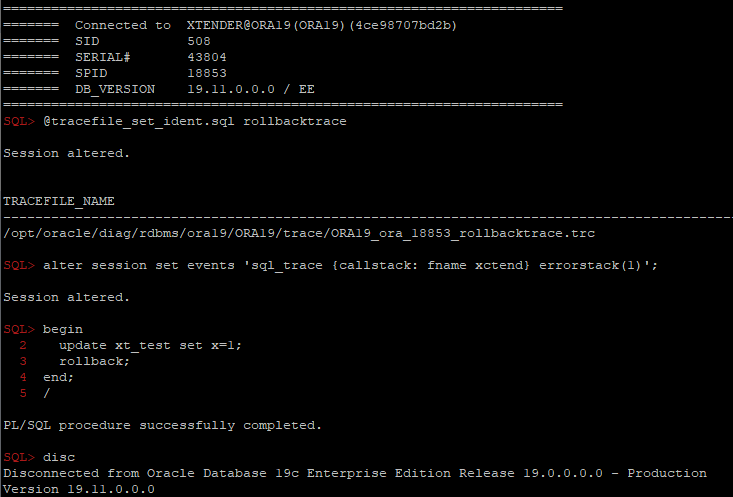
One of the easiest ways is to use diagnostic events:

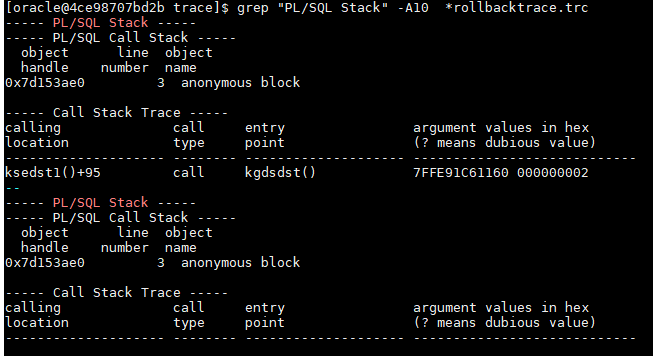
alter session set events 'sql_trace {callstack: fname xctend} errorstack(1)';
Image
Image
oracle pl/sql troubleshooting undocumented oracle

SQL*Plus tips #9: Reading traces and incident files

Posted on May 28, 2021 by Sayan Malakshinov Posted in diagnostic event 10046, oracle, SQL*Plus, SQL*PLus tips, trace, troubleshooting 2,631 Page views Leave a comment

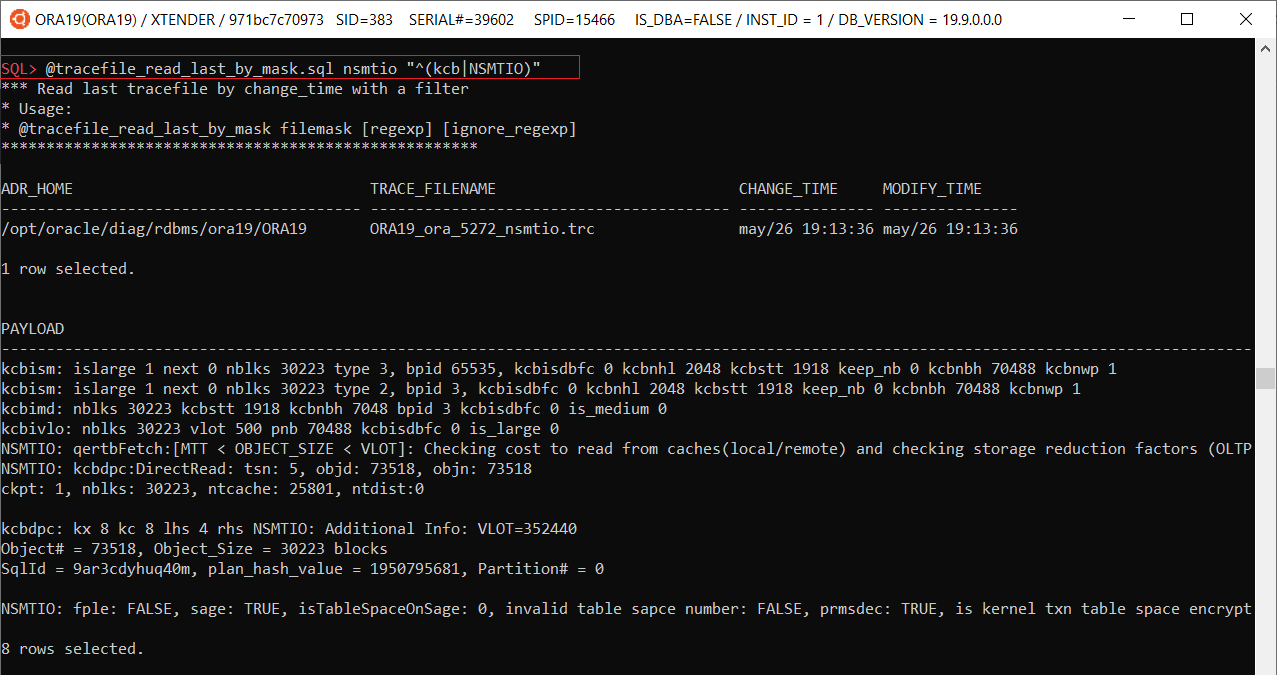
@tracefile_read_last_by_mask filemask [regexp] [ignore_regexp]
– finds last trace by filemask and filters rows by regexp and filters out rows by ignore_regexp:

@ tracefile_by_mask.sql [mask] – finds and shows last 10 trace files by mask

Continue reading→
SQL*Plus sqlplus traces

Oracle diagnostic events — Cheat sheet

Posted on May 20, 2021 by Sayan Malakshinov Posted in diagnostic event 10046, oracle, statistics, trace, troubleshooting, undocumented 9,237 Page views Leave a comment

Oracle diagnostic events is a great feature, but unfortunately poorly documented and nonintuitive, so it’s difficult to remember all events/actions/parameters and even read its internal documentation using oradebug. So I decided to compile its internal doc as a more convenient html-version (https://orasql.org/files/events/) and make a cheat sheet of some unknown or little-known use cases.

Example 1:

alter system set events 
   'kg_event[1476]
        {occurence: start_after 1, end_after 3}
            trace("stack is: %\n", shortstack())
            errorstack(2)
    ';
  1. kg_event[errno] – Kernel Generic event in library Generic for error number events, which instructs to trace ORA-errno errors;
  2. {occurence: start_after X, end_after Y} – is a filter, which instructs to skip X event checks and trace just Y times;
  3. trace(format, str1, str2, …, str15) – is a function from ACTIONS for printing into a trace file;
  4. shortstack() – is a function from ACTIONS , which returns a short call stack as a string;
  5. errorstack(level) – is a function from ACTIONS, which prints extended info (level: 0 – errorstack only, 1 – errorstack + call stack, 2 – as level 1 + processtate, 3 – as level 2 + context area). You can get more details with  PROCESSSTATE or SYSTEMSTATE. If you need just a call stack, you can use CALLSTACK(level) , with function arguments in case of level>1.

Example 2:

alter system set events 
    'trace[SQL_Compiler.* | SQL_Execution.*]
        [SQL: ...]
            {process: ospid = ...}
            {occurence:end_after 3}
                controlc_signal()';
Continue reading→
diagnostic events oracle oradebug

Easy way to tracing

Posted on October 12, 2012 by Sayan Malakshinov Posted in diagnostic event 10046, oracle, trace 2,147 Page views Leave a comment

Recently I needed to trace connections incoming by dblink, and I decided to make it more convenient, without the trigger.
It’s just three simple steps:

  1. Create new service
  2. Turn on tracing on this service
  3. Edit tnsnames and add dblink for this service if needed

So Oracle will trace all connections to this service.

Below code for sql*plus:

begin
  DBMS_SERVICE.CREATE_SERVICE('db11203trace','db11203trace');
end;
/
column new_value new_value new_value;
select p.value||',db11203trace' new_value from v$parameter p where p.name like 'service_names';
alter system set service_names='&new_value';
exec dbms_monitor.serv_mod_act_trace_enable(service_name => 'db11203trace',waits => true,binds => true);
photo Sayan Malakshinov

Oracle ACE Pro Oracle ACE Pro Alumni

DEVVYOracle Database Developer Choice Award winner

Oracle performance tuning expert

UK / Cambridge

LinkedIn   Twitter
sayan@orasql.org

Recent Posts

  • Oracle Telegram Bot
  • Partition Pruning and Global Indexes
  • Interval Search: Part 4. Dynamic Range Segmentation – interval quantization
  • Interval Search Series: Simplified, Advanced, and Custom Solutions
  • Interval Search: Part 3. Dynamic Range Segmentation – Custom Domain Index

Popular posts

Recent Comments

  • Oracle SQL | Interval Search: Part 4. Dynamic Range Segmentation – interval quantization on Interval Search: Part 3. Dynamic Range Segmentation – Custom Domain Index
  • Oracle SQL | Interval Search: Part 4. Dynamic Range Segmentation – interval quantization on Interval Search: Part 2. Dynamic Range Segmentation – Simplified
  • Oracle SQL | Interval Search: Part 4. Dynamic Range Segmentation – interval quantization on Interval Search: Optimizing Date Range Queries – Part 1
  • Oracle SQL | Interval Search Series: Simplified, Advanced, and Custom Solutions on Interval Search: Part 2. Dynamic Range Segmentation – Simplified
  • Oracle SQL | Interval Search: Part 2. Dynamic Range Segmentation – Simplified on Interval Search: Part 3. Dynamic Range Segmentation – Custom Domain Index

Blogroll

  • Alex Fatkulin
  • Alexander Anokhin
  • Andrey Nikolaev
  • Charles Hooper
  • Christian Antognini
  • Coskan Gundogar
  • David Fitzjarrell
  • Igor Usoltsev
  • Jonathan Lewis
  • Karl Arao
  • Mark Bobak
  • Martin Bach
  • Martin Berger
  • Neil Chandler
  • Randolf Geist
  • Richard Foote
  • Riyaj Shamsudeen
  • Tanel Poder
  • Timur Akhmadeev
  • Valentin Nikotin
©Sayan Malakshinov. Oracle SQL