You may know that table() (kokbf$ collection functions), xmltable and json_table functions block Join-Predicate PushDown(JPPD).
Simple example:
[sourcecode language=”sql”]
create table xtest(a, b, c) as
select mod(level,1000),level,rpad(‘x’,100,’x’)
from dual
connect by level<=1e4
/
create index itest on xtest(a)
/
create or replace view vtest as
select a,count(b) cnt
from xtest
group by a
/
call dbms_stats.gather_table_stats(user,’xtest’);
/
[/sourcecode]
select distinct v.*
from table(sys.odcinumberlist(1,2,3)) c, vtest v
where v.a = c.column_value;

Plan hash value: 699667151

-------------------------------------------------------------------------------------------------
| Id  | Operation                               | Name  | Rows  | Bytes | Cost (%CPU)| Time     |
-------------------------------------------------------------------------------------------------
|   0 | SELECT STATEMENT                        |       |     1 |    19 |    80   (4)| 00:00:01 |
|   1 |  HASH UNIQUE                            |       |     1 |    19 |    80   (4)| 00:00:01 |
|*  2 |   HASH JOIN                             |       |     1 |    19 |    79   (3)| 00:00:01 |
|   3 |    COLLECTION ITERATOR CONSTRUCTOR FETCH|       |     1 |     2 |    29   (0)| 00:00:01 |
|   4 |    VIEW                                 | VTEST |  1000 | 17000 |    49   (3)| 00:00:01 |
|   5 |     HASH GROUP BY                       |       |  1000 |  8000 |    49   (3)| 00:00:01 |
|   6 |      TABLE ACCESS FULL                  | XTEST | 10000 | 80000 |    48   (0)| 00:00:01 |
-------------------------------------------------------------------------------------------------

Predicate Information (identified by operation id):
---------------------------------------------------

   2 - access("V"."A"=VALUE(KOKBF$))
[sourcecode language=”sql”]
select/*+ cardinality(c 1) use_nl(v) push_pred(v) */ *
from json_table(‘{"a":[1,2,3]}’, ‘$.a[*]’ COLUMNS (a int PATH ‘$’)) c
,vtest v
where c.a = v.a;
Plan hash value: 664523328
——————————————————————————–
| Id | Operation | Name | Rows | Bytes | Cost (%CPU)| Time |
——————————————————————————–
| 0 | SELECT STATEMENT | | 1 | 28 | 78 (2)| 00:00:01 |
| 1 | NESTED LOOPS | | 1 | 28 | 78 (2)| 00:00:01 |
| 2 | JSONTABLE EVALUATION | | | | | |
|* 3 | VIEW | VTEST | 1 | 26 | 49 (3)| 00:00:01 |
| 4 | SORT GROUP BY | | 1000 | 8000 | 49 (3)| 00:00:01 |
| 5 | TABLE ACCESS FULL | XTEST | 10000 | 80000 | 48 (0)| 00:00:01 |
——————————————————————————–
Predicate Information (identified by operation id):
—————————————————
3 – filter("V"."A"="P"."A")
Hint Report (identified by operation id / Query Block Name / Object Alias):
Total hints for statement: 1 (U – Unused (1))
—————————————————————————
1 – SEL$F534CA49 / V@SEL$1
U – push_pred(v)
[/sourcecode]
[sourcecode language=”sql”]
select/*+ leading(c v) cardinality(c 1) use_nl(v) push_pred(v) */ v.*
from xmltable(‘(1,3)’ columns a int path ‘.’) c,vtest v
where c.a = v.a(+);
Plan hash value: 564839666
————————————————————————————————————
| Id | Operation | Name | Rows | Bytes | Cost (%CPU)| Time |
————————————————————————————————————
| 0 | SELECT STATEMENT | | 1 | 28 | 78 (2)| 00:00:01 |
| 1 | NESTED LOOPS OUTER | | 1 | 28 | 78 (2)| 00:00:01 |
| 2 | COLLECTION ITERATOR PICKLER FETCH| XQSEQUENCEFROMXMLTYPE | 1 | 2 | 29 (0)| 00:00:01 |
|* 3 | VIEW | VTEST | 1 | 26 | 49 (3)| 00:00:01 |
| 4 | SORT GROUP BY | | 1000 | 8000 | 49 (3)| 00:00:01 |
| 5 | TABLE ACCESS FULL | XTEST | 10000 | 80000 | 48 (0)| 00:00:01 |
————————————————————————————————————
Predicate Information (identified by operation id):
—————————————————
3 – filter("V"."A"(+)=CAST(TO_NUMBER(SYS_XQ_UPKXML2SQL(SYS_XQEXVAL(VALUE(KOKBF$),0,0,54525952,0),
50,1,2)) AS int ))
Hint Report (identified by operation id / Query Block Name / Object Alias):
Total hints for statement: 1 (U – Unused (1))
—————————————————————————
1 – SEL$6722A2F6 / V@SEL$1
U – push_pred(v)
[/sourcecode]
And compare with this:
create global temporary table temp_collection(a number);

insert into temp_collection select * from table(sys.odcinumberlist(1,2,3));

select/*+ cardinality(c 1) no_merge(v) */
   distinct v.*
from temp_collection c, vtest v
where v.a = c.a;

Plan hash value: 3561835411

------------------------------------------------------------------------------------------------------------
| Id  | Operation                                | Name            | Rows  | Bytes | Cost (%CPU)| Time     |
------------------------------------------------------------------------------------------------------------
|   0 | SELECT STATEMENT                         |                 |     1 |    26 |    41   (3)| 00:00:01 |
|   1 |  HASH UNIQUE                             |                 |     1 |    26 |    41   (3)| 00:00:01 |
|   2 |   NESTED LOOPS                           |                 |     1 |    26 |    40   (0)| 00:00:01 |
|   3 |    TABLE ACCESS FULL                     | TEMP_COLLECTION |     1 |    13 |    29   (0)| 00:00:01 |
|   4 |    VIEW PUSHED PREDICATE                 | VTEST           |     1 |    13 |    11   (0)| 00:00:01 |
|*  5 |     FILTER                               |                 |       |       |            |          |
|   6 |      SORT AGGREGATE                      |                 |     1 |     8 |            |          |
|   7 |       TABLE ACCESS BY INDEX ROWID BATCHED| XTEST           |    10 |    80 |    11   (0)| 00:00:01 |
|*  8 |        INDEX RANGE SCAN                  | ITEST           |    10 |       |     1   (0)| 00:00:01 |
------------------------------------------------------------------------------------------------------------

Predicate Information (identified by operation id):
---------------------------------------------------

   5 - filter(COUNT(*)>0)
   8 - access("A"="C"."A")
You can see that JPPD works fine in case of global temporary tables and, obviously, the first workaround is to avoid such functions with complex views.
But in such simple queries you have 2 other simple options:
1. you can avoid JPPD and get optimal plans using CVM(complex view merge) by just simply rewriting the query using IN or EXISTS:
select *
from vtest v
where v.a in (select/*+ cardinality(c 1) */ c.* from table(sys.odcinumberlist(1,2,3)) c);

Plan hash value: 1474391442

---------------------------------------------------------------------------------------------------
| Id  | Operation                                 | Name  | Rows  | Bytes | Cost (%CPU)| Time     |
---------------------------------------------------------------------------------------------------
|   0 | SELECT STATEMENT                          |       |    10 |   100 |    42   (5)| 00:00:01 |
|   1 |  SORT GROUP BY NOSORT                     |       |    10 |   100 |    42   (5)| 00:00:01 |
|   2 |   NESTED LOOPS                            |       |    10 |   100 |    41   (3)| 00:00:01 |
|   3 |    NESTED LOOPS                           |       |    10 |   100 |    41   (3)| 00:00:01 |
|   4 |     SORT UNIQUE                           |       |     1 |     2 |    29   (0)| 00:00:01 |
|   5 |      COLLECTION ITERATOR CONSTRUCTOR FETCH|       |     1 |     2 |    29   (0)| 00:00:01 |
|*  6 |     INDEX RANGE SCAN                      | ITEST |    10 |       |     1   (0)| 00:00:01 |
|   7 |    TABLE ACCESS BY INDEX ROWID            | XTEST |    10 |    80 |    11   (0)| 00:00:01 |
---------------------------------------------------------------------------------------------------

Predicate Information (identified by operation id):
---------------------------------------------------

   6 - access("A"=VALUE(KOKBF$))
[sourcecode language=”sql”]
select *
from vtest t
where t.a in (select/*+ cardinality(v 1) */ v.a from json_table(‘{"a":[1,2,3]}’, ‘$.a[*]’ COLUMNS (a int PATH ‘$’)) v);
Plan hash value: 2910004067
—————————————————————————————
| Id | Operation | Name | Rows | Bytes | Cost (%CPU)| Time |
—————————————————————————————
| 0 | SELECT STATEMENT | | 10 | 100 | 42 (5)| 00:00:01 |
| 1 | SORT GROUP BY NOSORT | | 10 | 100 | 42 (5)| 00:00:01 |
| 2 | NESTED LOOPS | | 10 | 100 | 41 (3)| 00:00:01 |
| 3 | NESTED LOOPS | | 10 | 100 | 41 (3)| 00:00:01 |
| 4 | SORT UNIQUE | | | | | |
| 5 | JSONTABLE EVALUATION | | | | | |
|* 6 | INDEX RANGE SCAN | ITEST | 10 | | 1 (0)| 00:00:01 |
| 7 | TABLE ACCESS BY INDEX ROWID| XTEST | 10 | 80 | 11 (0)| 00:00:01 |
—————————————————————————————
Predicate Information (identified by operation id):
—————————————————
6 – access("A"="P"."A")
select v.*
from vtest v
where exists(select/*+ cardinality(c 1) */ 1 from xmltable(‘(1,3)’ columns a int path ‘.’) c where c.a = v.a);
Plan hash value: 1646016183
—————————————————————————————————————
| Id | Operation | Name | Rows | Bytes | Cost (%CPU)| Time |
—————————————————————————————————————
| 0 | SELECT STATEMENT | | 10 | 100 | 42 (5)| 00:00:01 |
| 1 | SORT GROUP BY NOSORT | | 10 | 100 | 42 (5)| 00:00:01 |
| 2 | NESTED LOOPS | | 10 | 100 | 41 (3)| 00:00:01 |
| 3 | NESTED LOOPS | | 10 | 100 | 41 (3)| 00:00:01 |
| 4 | SORT UNIQUE | | 1 | 2 | 29 (0)| 00:00:01 |
| 5 | COLLECTION ITERATOR PICKLER FETCH| XQSEQUENCEFROMXMLTYPE | 1 | 2 | 29 (0)| 00:00:01 |
|* 6 | INDEX RANGE SCAN | ITEST | 10 | | 1 (0)| 00:00:01 |
| 7 | TABLE ACCESS BY INDEX ROWID | XTEST | 10 | 80 | 11 (0)| 00:00:01 |
—————————————————————————————————————
Predicate Information (identified by operation id):
—————————————————
6 – access("A"=CAST(TO_NUMBER(SYS_XQ_UPKXML2SQL(SYS_XQEXVAL(VALUE(KOKBF$),0,0,54525952,0),50,1,2)) AS int ))
[/sourcecode]
2. Avoid JPPD using lateral():
select/*+ cardinality(c 1) no_merge(lat) */
   distinct lat.*
from table(sys.odcinumberlist(1,2,3)) c,
     lateral(select * from vtest v where v.a = c.column_value) lat;

Plan hash value: 18036714

-----------------------------------------------------------------------------------------------------------
| Id  | Operation                               | Name            | Rows  | Bytes | Cost (%CPU)| Time     |
-----------------------------------------------------------------------------------------------------------
|   0 | SELECT STATEMENT                        |                 |    10 |   190 |    41   (3)| 00:00:01 |
|   1 |  HASH UNIQUE                            |                 |    10 |   190 |    41   (3)| 00:00:01 |
|   2 |   NESTED LOOPS                          |                 |    10 |   190 |    40   (0)| 00:00:01 |
|   3 |    COLLECTION ITERATOR CONSTRUCTOR FETCH|                 |     1 |     2 |    29   (0)| 00:00:01 |
|   4 |    VIEW                                 | VW_LAT_4DB60E85 |    10 |   170 |    11   (0)| 00:00:01 |
|   5 |     SORT GROUP BY                       |                 |    10 |    80 |    11   (0)| 00:00:01 |
|   6 |      TABLE ACCESS BY INDEX ROWID BATCHED| XTEST           |    10 |    80 |    11   (0)| 00:00:01 |
|*  7 |       INDEX RANGE SCAN                  | ITEST           |    10 |       |     1   (0)| 00:00:01 |
-----------------------------------------------------------------------------------------------------------

Predicate Information (identified by operation id):
---------------------------------------------------

   7 - access("A"=VALUE(KOKBF$))
Let’s see a bit more complex query:
[sourcecode language=”sql”]
create table xtest1(id primary key, a) as
select level,level from dual connect by level<=1000;
create table xtest2(a, b, c) as
select mod(level,1000),level,rpad(‘x’,100,’x’)
from dual
connect by level<=1e4
/
create index itest2 on xtest2(a)
/
create or replace view vtest2 as
select a,count(b) cnt
from xtest2
group by a
/
[/sourcecode]
select v.*
from xtest1 t1,
     vtest2 v
where t1.id in (select/*+ cardinality(c 1) */ * from table(sys.odcinumberlist(1,2,3)) c)
  and v.a = t1.a;

Plan hash value: 4293766070

-----------------------------------------------------------------------------------------------------------
| Id  | Operation                                  | Name         | Rows  | Bytes | Cost (%CPU)| Time     |
-----------------------------------------------------------------------------------------------------------
|   0 | SELECT STATEMENT                           |              |     1 |    36 |    80   (3)| 00:00:01 |
|*  1 |  HASH JOIN                                 |              |     1 |    36 |    80   (3)| 00:00:01 |
|   2 |   JOIN FILTER CREATE                       | :BF0000      |     1 |    10 |    31   (4)| 00:00:01 |
|   3 |    NESTED LOOPS                            |              |     1 |    10 |    31   (4)| 00:00:01 |
|   4 |     NESTED LOOPS                           |              |     1 |    10 |    31   (4)| 00:00:01 |
|   5 |      SORT UNIQUE                           |              |     1 |     2 |    29   (0)| 00:00:01 |
|   6 |       COLLECTION ITERATOR CONSTRUCTOR FETCH|              |     1 |     2 |    29   (0)| 00:00:01 |
|*  7 |      INDEX UNIQUE SCAN                     | SYS_C0026365 |     1 |       |     0   (0)| 00:00:01 |
|   8 |     TABLE ACCESS BY INDEX ROWID            | XTEST1       |     1 |     8 |     1   (0)| 00:00:01 |
|   9 |   VIEW                                     | VTEST2       |  1000 | 26000 |    49   (3)| 00:00:01 |
|  10 |    HASH GROUP BY                           |              |  1000 |  8000 |    49   (3)| 00:00:01 |
|  11 |     JOIN FILTER USE                        | :BF0000      | 10000 | 80000 |    48   (0)| 00:00:01 |
|* 12 |      TABLE ACCESS FULL                     | XTEST2       | 10000 | 80000 |    48   (0)| 00:00:01 |
-----------------------------------------------------------------------------------------------------------

Predicate Information (identified by operation id):
---------------------------------------------------

   1 - access("V"."A"="T1"."A")
   7 - access("T1"."ID"=VALUE(KOKBF$))
  12 - filter(SYS_OP_BLOOM_FILTER(:BF0000,"A"))
As you see, CVM can’t help in this case, but we can use lateral():
select/*+ no_merge(lat) */ lat.*
from xtest1 t1,
     lateral(select * from vtest2 v where v.a = t1.a) lat
where t1.id in (select/*+ cardinality(c 1) */ * from table(sys.odcinumberlist(1,2,3)) c);

Plan hash value: 1798023704

------------------------------------------------------------------------------------------------------------
| Id  | Operation                                | Name            | Rows  | Bytes | Cost (%CPU)| Time     |
------------------------------------------------------------------------------------------------------------
|   0 | SELECT STATEMENT                         |                 |    10 |   360 |    42   (3)| 00:00:01 |
|   1 |  NESTED LOOPS                            |                 |    10 |   360 |    42   (3)| 00:00:01 |
|   2 |   NESTED LOOPS                           |                 |     1 |    10 |    31   (4)| 00:00:01 |
|   3 |    SORT UNIQUE                           |                 |     1 |     2 |    29   (0)| 00:00:01 |
|   4 |     COLLECTION ITERATOR CONSTRUCTOR FETCH|                 |     1 |     2 |    29   (0)| 00:00:01 |
|   5 |    TABLE ACCESS BY INDEX ROWID           | XTEST1          |     1 |     8 |     1   (0)| 00:00:01 |
|*  6 |     INDEX UNIQUE SCAN                    | SYS_C0026365    |     1 |       |     0   (0)| 00:00:01 |
|   7 |   VIEW                                   | VW_LAT_A18161FF |    10 |   260 |    11   (0)| 00:00:01 |
|   8 |    SORT GROUP BY                         |                 |    10 |    80 |    11   (0)| 00:00:01 |
|   9 |     TABLE ACCESS BY INDEX ROWID BATCHED  | XTEST2          |    10 |    80 |    11   (0)| 00:00:01 |
|* 10 |      INDEX RANGE SCAN                    | ITEST2          |    10 |       |     1   (0)| 00:00:01 |
------------------------------------------------------------------------------------------------------------

Predicate Information (identified by operation id):
---------------------------------------------------

   6 - access("T1"."ID"=VALUE(KOKBF$))
  10 - access("A"="T1"."A")
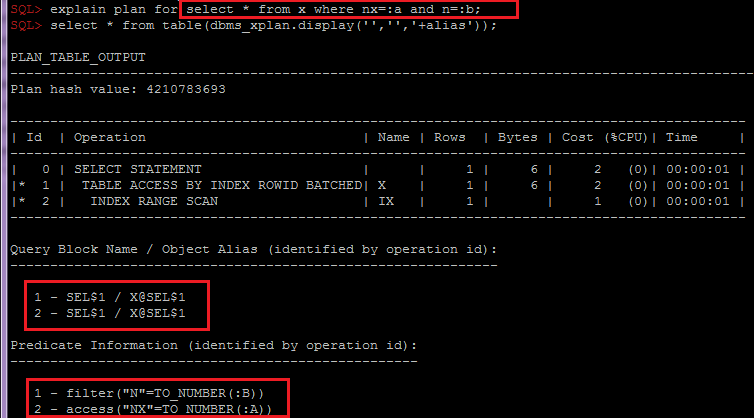
There is also another workaround with non-documented “precompute_subquery” hint:
select v.*
from xtest1 t1,
     vtest2 v
where t1.id in (select/*+ precompute_subquery */ * from table(sys.odcinumberlist(1,2,3)) c)
and v.a = t1.a;

Plan hash value: 1964829099

------------------------------------------------------------------------------------------------
| Id  | Operation                       | Name         | Rows  | Bytes | Cost (%CPU)| Time     |
------------------------------------------------------------------------------------------------
|   0 | SELECT STATEMENT                |              |    30 |   480 |    37   (3)| 00:00:01 |
|   1 |  HASH GROUP BY                  |              |    30 |   480 |    37   (3)| 00:00:01 |
|   2 |   NESTED LOOPS                  |              |    30 |   480 |    36   (0)| 00:00:01 |
|   3 |    NESTED LOOPS                 |              |    30 |   480 |    36   (0)| 00:00:01 |
|   4 |     INLIST ITERATOR             |              |       |       |            |          |
|   5 |      TABLE ACCESS BY INDEX ROWID| XTEST1       |     3 |    24 |     3   (0)| 00:00:01 |
|*  6 |       INDEX UNIQUE SCAN         | SYS_C0026365 |     3 |       |     2   (0)| 00:00:01 |
|*  7 |     INDEX RANGE SCAN            | ITEST2       |    10 |       |     1   (0)| 00:00:01 |
|   8 |    TABLE ACCESS BY INDEX ROWID  | XTEST2       |    10 |    80 |    11   (0)| 00:00:01 |
------------------------------------------------------------------------------------------------

Predicate Information (identified by operation id):
---------------------------------------------------

   6 - access("T1"."ID"=1 OR "T1"."ID"=2 OR "T1"."ID"=3)
   7 - access("A"="T1"."A")
It can help even in most difficult cases, for example if you can’t rewrite query (in this case you can create sql patch or sql profile with “precompute_subquery”), but I wouldn’t suggest it since “precompute_subquery” is non-documented, it can be used only with simple collections and has limitation in 1000 values.
I’d suggest to use the workaround with lateral, since it’s most reliable and very simple.