Oracle SQL
  • LICENSE

Category Archives: troubleshooting

Lateral view decorrelation(VW_DCL) causes wrong results with rownum

Posted on February 16, 2019 by Sayan Malakshinov Posted in 12c, bug, CBO, oracle, query optimizing, rownum, troubleshooting 1,930 Page views 3 Comments

Everyone knows that rownum in inline views blocks many query transformations, for example pushing/pulling predicates, scalar subquery unnesting, etc, and many people use it for such purposes as a workaround to avoid unwanted transformations(or even CBO bugs).

Obviously, the main reason of that is different calculation of rownum:

If we pull the predicate “column_value = 3″ from the following query to higher level
[sourcecode language=”sql” highlight=””]
select *
from (select * from table(odcinumberlist(1,1,1,2,2,2,3,3,3)) order by 1)
where rownum <= 2
and column_value = 3;

COLUMN_VALUE
————
3
3
[/sourcecode]
we will get different results:
[sourcecode language=”sql” highlight=”8″]
select *
from (select *
from (select * from table(odcinumberlist(1,1,1,2,2,2,3,3,3)) order by 1)
where rownum <= 2
)
where column_value = 3;

no rows selected
[/sourcecode]
Doc ID 62340.1

[collapse]

But we recently encountered a bug with it: lateral view with ROWNUM returns wrong results in case of lateral view decorrelation.
Compare results of this query with and without no_decorrelation hint:

with 
 t1(a) as (select * from table(odcinumberlist(1,3)))
,t2(b) as (select * from table(odcinumberlist(1,1,3,3)))
,t(id) as (select * from table(odcinumberlist(1,2,3)))
select
  *
from t,
     lateral(select/*+ no_decorrelate */ rownum rn 
             from t1,t2 
             where t1.a=t2.b and t1.a = t.id
            )(+)
order by 1,2;

        ID         RN
---------- ----------
         1          1
         1          2
         2
         3          1
         3          2
with 
 t1(a) as (select * from table(odcinumberlist(1,3)))
,t2(b) as (select * from table(odcinumberlist(1,1,3,3)))
,t(id) as (select * from table(odcinumberlist(1,2,3)))
select
  *
from t,
     lateral(select rownum rn 
             from t1,t2 
             where t1.a=t2.b and t1.a = t.id
            )(+)
order by 1,2;

        ID         RN
---------- ----------
         1          1
         1          2
         2
         3          3
         3          4

Of course, we can draw conclusions even from these results: we can see that in case of decorrelation(query with hint) rownum was calculated before the join. But to be sure we can check optimizer’s trace 10053:

Final query after transformations:

[sourcecode language=”sql”]
******* UNPARSED QUERY IS *******
SELECT VALUE(KOKBF$2) "ID", "VW_DCL_76980902"."RN" "RN"
FROM TABLE("ODCINUMBERLIST"(1, 2, 3)) "KOKBF$2",
(SELECT ROWNUM "RN_0", VALUE(KOKBF$0) "ITEM_3"
FROM TABLE("ODCINUMBERLIST"(1, 3)) "KOKBF$0",
TABLE("ODCINUMBERLIST"(1, 1, 3, 3)) "KOKBF$1"
WHERE VALUE(KOKBF$0) = VALUE(KOKBF$1)
) "VW_DCL_76980902"
WHERE "VW_DCL_76980902"."ITEM_3"(+) = VALUE(KOKBF$2)
ORDER BY VALUE(KOKBF$2), "VW_DCL_76980902"."RN"

*************************
[/sourcecode]

[collapse]

I’ll modify it a bit just to make it more readable:
we can see that

select
  *
from t,
     lateral(select rownum rn 
             from t1,t2 
             where t1.a=t2.b and t1.a = t.id)(+)
order by 1,2;

was transformed to

select
  t.id, dcl.rn
from t,
     (select rownum rn 
      from t1,t2 
      where t1.a=t2.b) dcl
where dcl.a(+) = t.id
order by 1,2;

And it confirms that rownum was calculated on the different dataset (t1-t2 join) without join filter by table t.
I created SR with Severity 1 (SR #3-19117219271) more than a month ago, but unfortunately Oracle development doesn’t want to fix this bug and moreover they say that is not a bug. So I think this is a dangerous precedent and probably soon we will not be able to be sure in the calculation of rownum and old fixes…

bug cbo lateral query optimization troubleshooting

Top-N again: fetch first N rows only vs rownum

Posted on December 30, 2018 by Sayan Malakshinov Posted in adaptive serial direct path reads, CBO, oracle, query optimizing, SQL, troubleshooting 7,305 Page views Leave a comment

Three interesting myths about rowlimiting clause vs rownum have recently been posted on our Russian forum:

  1. TopN query with rownum<=N is always faster than "fetch first N rows only" (ie. row_number()over(order by ...)<=N)
  2. “fetch first N rows only” is always faster than rownum<=N
  3. “SORT ORDER BY STOPKEY” stores just N top records during sorting, while “WINDOW SORT PUSHED RANK” sorts all input and stores all records sorted in memory.

Interestingly that after Vyacheslav posted first statement as an axiom and someone posted old tests(from 2009) and few people made own tests which showed that “fetch first N rows” is about 2-3 times faster than the query with rownum, the final decision was that “fetch first” is always faster.

First of all I want to show that statement #3 is wrong and “WINDOW SORT PUSHED RANK” with row_number works similarly as “SORT ORDER BY STOPKEY”:
It’s pretty easy to show using sort trace:
Let’s create simple small table Tests1 with 1000 rows where A is in range 1-1000 (just 1 block):

create table test1(a not null, b) as
  select level, level from dual connect by level<=1000;

alter session set max_dump_file_size=unlimited;
ALTER SESSION SET EVENTS '10032 trace name context forever, level 10';

ALTER SESSION SET tracefile_identifier = 'rownum';
select * from (select * from test1 order by a) where rownum<=10;

ALTER SESSION SET tracefile_identifier = 'rownumber';
select * from test1 order by a fetch first 10 rows only;

And we can see from the trace files that both queries did the same number of comparisons:

rownum:

[sourcecode language=”sql” highlight=”7″]
—– Current SQL Statement for this session (sql_id=bbg66rcbt76zt) —–
select * from (select * from test1 order by a) where rownum<=10

—- Sort Statistics ——————————
Input records 1000
Output records 10
Total number of comparisons performed 999
Comparisons performed by in-memory sort 999
Total amount of memory used 2048
Uses version 1 sort
—- End of Sort Statistics ———————–
[/sourcecode]

[collapse]
row_number

[sourcecode language=”sql” highlight=”7″]
—– Current SQL Statement for this session (sql_id=duuy4bvaz3d0q) —–
select * from test1 order by a fetch first 10 rows only

—- Sort Statistics ——————————
Input records 1000
Output records 10
Total number of comparisons performed 999
Comparisons performed by in-memory sort 999
Total amount of memory used 2048
Uses version 1 sort
—- End of Sort Statistics ———————–
[/sourcecode]

[collapse]

Ie. each row (except first one) was compared with the biggest value from top 10 values and since they were bigger than top 10 value, oracle doesn’t compare it with other TopN values.

And if we change the order of rows in the table both of these queries will do the same number of comparisons again:

from 999 to 0

[sourcecode language=”sql”]
create table test1(a not null, b) as
select 1000-level, level from dual connect by level<=1000;

alter session set max_dump_file_size=unlimited;
ALTER SESSION SET EVENTS ‘10032 trace name context forever, level 10’;

ALTER SESSION SET tracefile_identifier = ‘rownum’;
select * from (select * from test1 order by a) where rownum<=10;

ALTER SESSION SET tracefile_identifier = ‘rownumber’;
select * from test1 order by a fetch first 10 rows only;
[/sourcecode]

[collapse]
rownum

[sourcecode language=”sql” highlight=”7″]
—– Current SQL Statement for this session (sql_id=bbg66rcbt76zt) —–
select * from (select * from test1 order by a) where rownum<=10

—- Sort Statistics ——————————
Input records 1000
Output records 1000
Total number of comparisons performed 4976
Comparisons performed by in-memory sort 4976
Total amount of memory used 2048
Uses version 1 sort
—- End of Sort Statistics ———————–
[/sourcecode]

[collapse]
row_number

[sourcecode language=”sql” highlight=”7″]
—– Current SQL Statement for this session (sql_id=duuy4bvaz3d0q) —–
select * from test1 order by a fetch first 10 rows only

—- Sort Statistics ——————————
Input records 1000
Output records 1000
Total number of comparisons performed 4976
Comparisons performed by in-memory sort 4976
Total amount of memory used 2048
Uses version 1 sort
—- End of Sort Statistics ———————–
[/sourcecode]

[collapse]

We can see that both queries required much more comparisons(4976) here, that’s because each new value is smaller than the biggest value from the topN and even smaller than lowest value, so oracle should get right position for it and it requires 5 comparisons for that (it compares with 10th value, then with 6th, 3rd, 2nd and 1st values from top10). Obviously it makes less comparisons for the first 10 rows.

Now let’s talk about statements #1 and #2:
We know that rownum forces optimizer_mode to switch to “first K rows”, because of the parameter “_optimizer_rownum_pred_based_fkr”

SQL> @param_ rownum

NAME                               VALUE  DEFLT  TYPE      DESCRIPTION
---------------------------------- ------ ------ --------- ------------------------------------------------------
_optimizer_rownum_bind_default     10     TRUE   number    Default value to use for rownum bind
_optimizer_rownum_pred_based_fkr   TRUE   TRUE   boolean   enable the use of first K rows due to rownum predicate
_px_rownum_pd                      TRUE   TRUE   boolean   turn off/on parallel rownum pushdown optimization

while fetch first/row_number doesn’t (it will be changed after the patch #22174392) and it leads to the following consequences:
1. first_rows disables serial direct reads optimization(or smartscan on Exadata), that’s why the tests with big tables showed that “fetch first” were much faster than the query with rownum.
So if we set “_serial_direct_read”=always, we get the same performance in both tests (within the margin of error).

2. In cases when index access (index full scan/index range scan) is better, CBO differently calculates the cardinality of underlying INDEX FULL(range) SCAN:
the query with rownum is optimized for first_k_rows and the cardinality of index access is equal to K rows, but CBO doesn’t reduce cardinality for “fetch first”, so the cost of index access is much higher, compare them:

rownum

[sourcecode language=”sql” highlight=”13″]
SQL> explain plan for
2 select *
3 from (select * from test order by a,b)
4 where rownum<=10;

——————————————————————————————–
| Id | Operation | Name | Rows | Bytes | Cost (%CPU)| Time |
——————————————————————————————–
| 0 | SELECT STATEMENT | | 10 | 390 | 4 (0)| 00:00:01 |
|* 1 | COUNT STOPKEY | | | | | |
| 2 | VIEW | | 10 | 390 | 4 (0)| 00:00:01 |
| 3 | TABLE ACCESS BY INDEX ROWID| TEST | 1000K| 12M| 4 (0)| 00:00:01 |
| 4 | INDEX FULL SCAN | IX_TEST_AB | 10 | | 3 (0)| 00:00:01 |
——————————————————————————————–

Predicate Information (identified by operation id):
—————————————————

1 – filter(ROWNUM<=10)
[/sourcecode]

[collapse]
fetch first

[sourcecode language=”sql” highlight=”13″]
SQL> explain plan for
2 select *
3 from test
4 order by a,b
5 fetch first 10 rows only;

—————————————————————————————–
| Id | Operation | Name | Rows | Bytes |TempSpc| Cost (%CPU)| Time |
—————————————————————————————–
| 0 | SELECT STATEMENT | | 10 | 780 | | 5438 (1)| 00:00:01 |
|* 1 | VIEW | | 10 | 780 | | 5438 (1)| 00:00:01 |
|* 2 | WINDOW SORT PUSHED RANK| | 1000K| 12M| 22M| 5438 (1)| 00:00:01 |
| 3 | TABLE ACCESS FULL | TEST | 1000K| 12M| | 690 (1)| 00:00:01 |
—————————————————————————————–

Predicate Information (identified by operation id):
—————————————————

1 – filter("from$_subquery$_002"."rowlimit_$$_rownumber"<=10)
2 – filter(ROW_NUMBER() OVER ( ORDER BY "TEST"."A","TEST"."B")<=10)
[/sourcecode]

[collapse]
fetch first + first_rows

[sourcecode language=”sql” highlight=”14″]
SQL> explain plan for
2 select/*+ first_rows */ *
3 from test
4 order by a,b
5 fetch first 10 rows only;

——————————————————————————————–
| Id | Operation | Name | Rows | Bytes | Cost (%CPU)| Time |
——————————————————————————————–
| 0 | SELECT STATEMENT | | 10 | 780 | 27376 (1)| 00:00:02 |
|* 1 | VIEW | | 10 | 780 | 27376 (1)| 00:00:02 |
|* 2 | WINDOW NOSORT STOPKEY | | 1000K| 12M| 27376 (1)| 00:00:02 |
| 3 | TABLE ACCESS BY INDEX ROWID| TEST | 1000K| 12M| 27376 (1)| 00:00:02 |
| 4 | INDEX FULL SCAN | IX_TEST_AB | 1000K| | 2637 (1)| 00:00:01 |
——————————————————————————————–

Predicate Information (identified by operation id):
—————————————————

1 – filter("from$_subquery$_002"."rowlimit_$$_rownumber"<=10)
2 – filter(ROW_NUMBER() OVER ( ORDER BY "TEST"."A","TEST"."B")<=10)
[/sourcecode]

[collapse]
fetch first + index

[sourcecode language=”sql” highlight=”14″]
SQL> explain plan for
2 select/*+ index(test (a,b)) */ *
3 from test
4 order by a,b
5 fetch first 10 rows only;

——————————————————————————————–
| Id | Operation | Name | Rows | Bytes | Cost (%CPU)| Time |
——————————————————————————————–
| 0 | SELECT STATEMENT | | 10 | 780 | 27376 (1)| 00:00:02 |
|* 1 | VIEW | | 10 | 780 | 27376 (1)| 00:00:02 |
|* 2 | WINDOW NOSORT STOPKEY | | 1000K| 12M| 27376 (1)| 00:00:02 |
| 3 | TABLE ACCESS BY INDEX ROWID| TEST | 1000K| 12M| 27376 (1)| 00:00:02 |
| 4 | INDEX FULL SCAN | IX_TEST_AB | 1000K| | 2637 (1)| 00:00:01 |
——————————————————————————————–

Predicate Information (identified by operation id):
—————————————————

1 – filter("from$_subquery$_002"."rowlimit_$$_rownumber"<=10)
2 – filter(ROW_NUMBER() OVER ( ORDER BY "TEST"."A","TEST"."B")<=10)
[/sourcecode]

[collapse]

So in this case we can add hints “first_rows” or “index”, or install the patch #22174392.

ps. I thought to post this note later, since I hadn’t time enough to add other interesting details about the different TopN variants, including “with tie”, rank(), etc, so I’ll post another note with more details later.

cbo direct path reads oracle query optimization

How to tell if the Exadata column cache is fully loaded

Posted on January 23, 2018 by Roger MacNicol Posted in oracle, SmartScan, statistics, troubleshooting 1,922 Page views 1 Comment

When a background activity is happening on the cell you typically can’t use RDBMS v$ views to monitor it in the same way. One such question is how to tell if a segment is fully loaded in the Exadata column cache since this does not appear in the equivalent In-Memory v$ views.

When a segment is scanned by Smart Scan sufficiently often to be eligible the AUTOKEEP pool (typically that means at least twice an hour), the eligible 1MB chunks are written to flash in 12.1.0.2 style format, and put on a background queue. Lower priority tasks pick up the queued 1MB 12.1.0.2 format chunks from the flash cache, run them though the In-Memory loader, and rewrite the pure columnar representation in place of the old 12.1.0.2 style column cache chunks.

The easiest way that I know of to tell when this completes is to monitor that background activity is to use the following query until it shows zero:

select name, sum(value) value from (
      select extractvalue(value(t),'/stat/@name') name,
            extractvalue(value(t),'/stat') value
      from v$cell_state cs,
           table(xmlsequence(extract(xmltype(cs.statistics_value),
                                     '//stats[@type="columnarcache"]/stat'))) t
     where statistics_type='CELL')
     where name in ('outstanding_imcpop_requests')
     group by name;

oracle Roger MacNicol SmartScan v$cell_state

“Collection iterator pickler fetch”: pipelined vs simple table functions

Posted on December 13, 2017 by Sayan Malakshinov Posted in oracle, PL/SQL, PL/SQL optimization, query optimizing, SQL, troubleshooting 2,578 Page views 2 Comments

Alex R recently discovered interesting thing: in SQL pipelined functions work much faster than simple non-pipelined table functions, so if you already have simple non-pipelined table function and want to get its results in sql (select * from table(fff)), it’s much better to create another pipelined function which will get and return its results through PIPE ROW().

A bit more details:

Assume we need to return collection “RESULT” from PL/SQL function into SQL query “select * from table(function_F(…))”.
If we create 2 similar functions: pipelined f_pipe and simple non-pipelined f_non_pipe,

create or replace function f_pipe(n int) return tt_id_value pipelined 
as
  result tt_id_value;
begin
  ...
  for i in 1..n loop
    pipe row (result(i));
  end loop;
end f_pipe;
/
create or replace function f_non_pipe(n int) return tt_id_value 
as
  result tt_id_value;
begin
  ...
  return result;
end f_non_pipe;
/

Full functions definitions

[sourcecode language=”sql”]
create or replace type to_id_value as object (id int, value int)
/
create or replace type tt_id_value as table of to_id_value
/
create or replace function f_pipe(n int) return tt_id_value pipelined
as
result tt_id_value;

procedure gen is
begin
result:=tt_id_value();
result.extend(n);
for i in 1..n loop
result(i):=to_id_value(i, 1);
end loop;
end;
begin
gen();
for i in 1..n loop
pipe row (result(i));
end loop;
end f_pipe;
/
create or replace function f_non_pipe(n int) return tt_id_value
as
result tt_id_value;

procedure gen is
begin
result:=tt_id_value();
result.extend(n);
for i in 1..n loop
result(i):=to_id_value(i, 1);
end loop;
end;
begin
gen();
return result;
end f_non_pipe;
/
create or replace function f_pipe_for_nonpipe(n int) return tt_id_value pipelined
as
result tt_id_value;
begin
result:=f_non_pipe(n);
for i in 1..result.count loop
pipe row (result(i));
end loop;
end;
/
create or replace function f_udf_pipe(n int) return tt_id_value pipelined
as
result tt_id_value;

procedure gen is
begin
result:=tt_id_value();
result.extend(n);
for i in 1..n loop
result(i):=to_id_value(i, 1);
end loop;
end;
begin
gen();
for i in 1..n loop
pipe row (result(i));
end loop;
end;
/
create or replace function f_udf_non_pipe(n int) return tt_id_value
as
result tt_id_value;

procedure gen is
begin
result:=tt_id_value();
result.extend(n);
for i in 1..n loop
result(i):=to_id_value(i, 1);
end loop;
end;
begin
gen();
return result;
end;
/
[/sourcecode]

[collapse]
Test queries

[sourcecode language=”sql”]
set echo on feed only timing on;
–alter session set optimizer_adaptive_plans=false;
–alter session set "_optimizer_use_feedback"=false;

select sum(id * value) s from table(f_pipe(&1));
select sum(id * value) s from table(f_non_pipe(&1));
select sum(id * value) s from table(f_pipe_for_nonpipe(&1));
select sum(id * value) s from table(f_udf_pipe(&1));
select sum(id * value) s from table(f_udf_non_pipe(&1));
with function f_inline_non_pipe(n int) return tt_id_value
as
result tt_id_value;
begin
result:=tt_id_value();
result.extend(n);
for i in 1..n loop
result(i):=to_id_value(i, 1);
end loop;
return result;
end;
select sum(id * value) s from table(f_inline_non_pipe(&1));
/
set timing off echo off feed on;
[/sourcecode]

[collapse]

we’ll find that the function with simple “return result” works at least twice slower than pipelined function:

Function 1 000 000 elements 100 000 elements
F_PIPE 2.46 0.20
F_NON_PIPE 4.39 0.44
F_PIPE_FOR_NONPIPE 2.61 0.26
F_UDF_PIPE 2.06 0.20
F_UDF_NON_PIPE 4.46 0.44

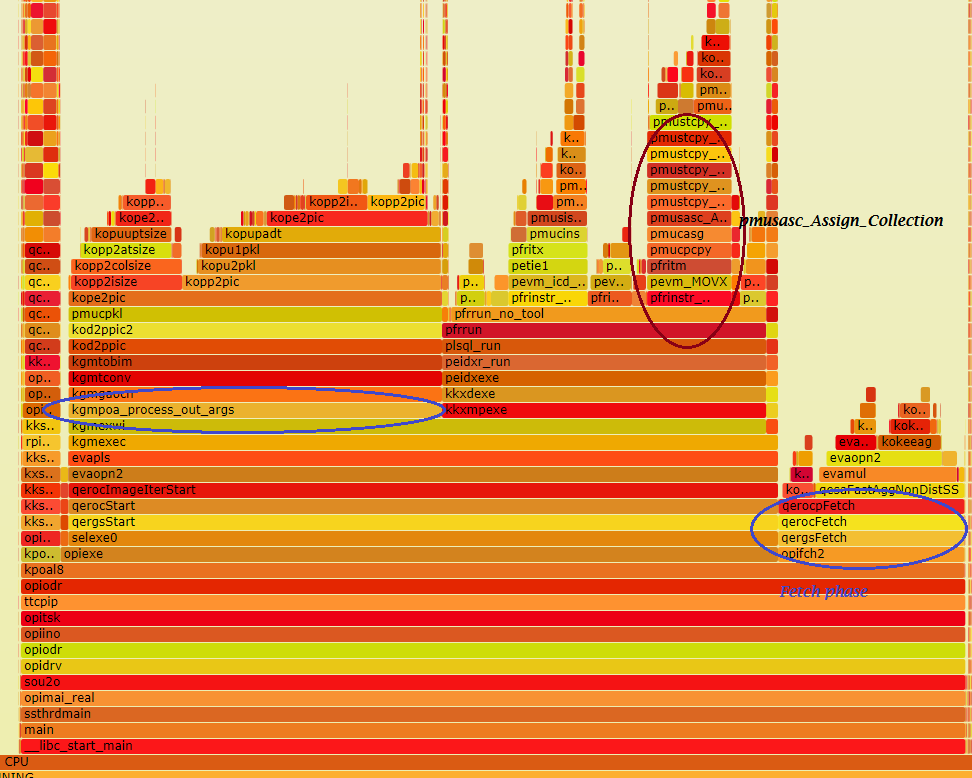
I was really surprised that even “COLLECTION ITERATOR PICKLER FETCH” with F_PIPE_FOR_NONPIPE that gets result of F_NON_PIPE and returns it through PIPE ROW() works almost twice faster than F_NON_PIPE, so I decided to analyze it using stapflame by Frits Hoogland.

I added “dbms_lock.sleep(1)” into both of these function after collection generation, to compare the difference only between “pipe row” in loop and “return result”:

Modified functions

[sourcecode language=”sql”]
create or replace function f_pipe(n int) return tt_id_value pipelined
as
result tt_id_value;

procedure gen is
begin
result:=tt_id_value();
result.extend(n);
for i in 1..n loop
result(i):=to_id_value(i, 1);
end loop;
end;
begin
gen();
dbms_lock.sleep(1);
for i in 1..n loop
pipe row (result(i));
end loop;
end f_pipe;
/
create or replace function f_non_pipe(n int) return tt_id_value
as
result tt_id_value;

procedure gen is
begin
result:=tt_id_value();
result.extend(n);
for i in 1..n loop
result(i):=to_id_value(i, 1);
end loop;
end;
begin
gen();
dbms_lock.sleep(1);
return result;
end f_non_pipe;
/
[/sourcecode]

[collapse]

And stapflame showed that almost all overhead was consumed by the function “kgmpoa_Assign_Out_Arguments”:

I don’t know what this function is doing exactly, but we can see that oracle assign collection a bit later.
From other functions in this stack(pmucpkl, kopp2isize, kopp2colsize, kopp2atsize(attribute?), kopuadt) I suspect that is some type of preprocessiong of return arguments.
What do you think about it?

Full stapflame output:
stapflame_nonpipe
stapflame_pipe

oracle pipelined functions pl/sql pl/sql functions pl/sql optimization

When bloggers get it wrong – part 2

Posted on May 4, 2017 by Roger MacNicol Posted in adaptive serial direct path reads, oracle, SmartScan, trace, troubleshooting 2,034 Page views 1 Comment

In Part 2 we are going to look at making use of the trace events that show what was discussed in Part 1. 
NB: Oracle no longer adds new numeric trace events, going forward new trace events use the Unified Tracing Service whose grammer is much simpler. The elements we need are:

trace[[x.]y] disk = [ lowest | low | medium | high | highest ]

For example Table Scan tracing is in the DATA hierachy:

[1] DATA
[2] KDS    “Kernel Data Scan”
[3] KDSFTS  “Full Table Scan”
[3] KDSRID  “RowID”

‘trace[KDSFTS] disk low’ – only trace full table scans
‘trace[KDSRID] disk low’ – only trace fetch by rowid
‘trace[KDS.*] disk low’ – trace both table scans and fetch by rowid
NB: don’t use ‘lowest’ with KDS – it is used for memory tracing only

Tracing Full Table Scans: KDSFTS

At the beginning of a granule we see if it is possible to use Turbo Scan (which is a prerequisite for using Exadata Smart Scan) and the data object number being scanned:

Continue reading→
abtc direct path reads oracle Roger MacNicol SmartScan

How to speed up slow unicode migration of a table with xmltype columns

Posted on February 20, 2017 by Sayan Malakshinov Posted in oracle, parallel, query optimizing, troubleshooting 2,294 Page views Leave a comment

Recently I have had an issue with slow unicode migration of the database upgraded from 10g to 12.1.0.2. The main problem was a table with xmltype: we spent about 4 hours for this table(~17GB) during test migration, though all other tables (~190GB) migrated just for about 20 minutes.
We used DMU(Database Migration Assistant for Unicode), and the root cause of the problem was update statement generated by DMU for this table:

update  /*+ PARALLEL(A,16)*/ "RRR"."T_XMLDATA" A  set A."SYS_NC00011$" = SYS_OP_CSCONV(A."SYS_NC00011$", 'AL16UTF16')

“SYS_NC00011$” was internal hidden CLOB column used to store XMLTYPE. As you can see DMU added PARALLEL hint, but though oracle can use parallel dml for xmltype since 12.1.0.1, we can’t use it because of its’ limitations:

Changes in Oracle Database 12c Release 1 (12.1.0.1) for Oracle XML DB

Parallel DML Support for XMLType
Support for parallel DML has been improved for XMLType storage model binary XML using SecureFiles LOBs. The performance and scalability have been improved for both CREATE TABLE AS SELECT and INSERT AS SELECT.

Restrictions on Parallel DML

Parallel DML can be done on tables with LOB columns provided the table is partitioned. However, intra-partition parallelism is not supported.

For non-partitioned tables with LOB columns, parallel INSERT operations are supported provided that the LOB columns are declared as SecureFiles LOBs. Parallel UPDATE, DELETE, and MERGE operations on such tables are not supported.

Btw, Oracle didn’t support parallel dml for xmltype on previous releases:

No Parallel DML for XMLType – DML operations on XMLType data are always performed in serial. Parallel DML is not supported for XMLType. (Parallel query and DDL are supported for XMLType.)

So I had to use manual parallelization:
1. Monitor “Convert application tables” step through “View Table Conversion progress” and press “Stop” button during conversion of this table.
2. Create table with ROWIDs of this table and split them into 16 groups:

create table tmp_rids as 
select rowid rid, ntile(16)over(order by rowid) grp 
from t_xmldata;

3. Execute

ALTER SYSTEM SET EVENTS '22838 TRACE NAME CONTEXT LEVEL 1,FOREVER'; 

to avoid “ORA-22839: Direct updates on SYS_NC columns are disallowed”
4. Start 16 sessions and each of them have to update own part:

update t_xmldata A 
set A."SYS_NC00011$" = SYS_OP_CSCONV(A."SYS_NC00011$", 'AL16UTF16') 
where rowid in (select rid from tmp_rids where grp=&grp);
commit;

5. Disable event 22838:

ALTER SYSTEM SET EVENTS '22838 TRACE NAME CONTEXT OFF'; 

6. Open “View Table Conversion progress” window, click on this table and change “Retry” to “Skip” option for the update step.

This simple method allowed to make unicode migration about 16 times faster.

12c oracle parallel dml query optimization

select * from table where rownum=1

Posted on February 9, 2015 by Sayan Malakshinov Posted in adaptive serial direct path reads, CBO, oracle, troubleshooting 2,511 Page views 1 Comment

I never thought I would have to optimize so simple query as

select col1, col2, col4, col7 from table where rownum=1

(even though I read recently “SELECT * FROM TABLE” Runs Out Of TEMP Space)
But a few days ago frequent executions of this query caused big problems on the one of our databases(11.2.0.3) because of adaptive serial direct path reads.

I don’t know why, but I felt intuitively that full table scan with “First K rows” optimization (“_optimizer_rownum_pred_based_fkr“=true) should turn off adaptive serial direct path reads. It seems quite logical to me.

PS. Unfortunately I had a little time, so I didn’t investigate what process and why it was doing that, I just created profile with “index full scan” access, and it completely solved the problem.

cbo direct path reads

When v$sesstat statistics are updated

Posted on March 21, 2014 by Sayan Malakshinov Posted in oracle, PL/SQL, runstats, statistics, troubleshooting, undocumented 2,908 Page views Leave a comment

Craig Shallahamer wrote excellent article “When is v$sesstat really updated?”.
And my today post just a little addition and correction about the difference of updating ‘Db time’ and ‘CPU used by this session’ statistics.

Test #1

In this test I want to show that the statistics will be updated after every fetch call.
I have set arraysize=2, so sql*plus will fetch by 2 rows:
(full script)

-- Result will be fetched by 2 rows:
set arraysize 2;
-- this query generates CPU consumption 
-- in the scalar subquery on fetch phase,
-- so CPU consumption will be separated 
-- into several periods between fetch calls:
with gen as (
            select/*+ materialize */
               level n, lpad(level,400) padding
            from dual
            connect by level<=200
            )
    ,stat as (
            select/*+ inline */
               sid,name,value 
            from v$mystat st, v$statname sn
            where st.statistic#=sn.statistic#
              and sn.name in ('DB time'
                             ,'CPU used by this session'
                             ,'user calls'
                             ,'recursive calls')
            )
--first rows just for avoiding SQL*Plus effect with fetching 1 row at start,
-- others will be fetched by "arraysize" rows:
select null rn,null cnt,null dbtime,null cpu,null user_calls, null recursive_calls from dual
union all -- main query:
select
   rownum rn
  ,(select count(*) from gen g1, gen g2, gen g3 where g1.n>g2.n and g1.n*0=main.n*0) cnt
  ,(select value from stat where sid*0=n*0 and name = 'DB time'                    ) dbtime
  ,(select value from stat where sid*0=n*0 and name = 'CPU used by this session'   ) cpu
  ,(select value from stat where sid*0=n*0 and name = 'user calls'                 ) user_calls
  ,(select value from stat where sid*0=n*0 and name = 'recursive calls'            ) recursive_calls
from gen main
where rownum<=10;
set arraysize 15;

Test results:

SQL> @tests/dbtime

        RN        CNT     DBTIME        CPU USER_CALLS RECURSIVE_CALLS
---------- ---------- ---------- ---------- ---------- ---------------

         1    3980000      12021      11989        200             472
         2    3980000      12021      11989        200             472
         3    3980000      12121      12089        201             472
         4    3980000      12121      12089        201             472
         5    3980000      12220      12186        202             472
         6    3980000      12220      12186        202             472
         7    3980000      12317      12283        203             472
         8    3980000      12317      12283        203             472
         9    3980000      12417      12383        204             472
        10    3980000      12417      12383        204             472

As you can see the statistics are updated after every fetch call.

Test #2

Now since we already tested simple sql query, I want to do a little bit more complicated test with PL/SQL:
I’m going to write single PL/SQL block with next algorithm:
1. Saving stats
2. Executing some pl/sql code with CPU consumption
3. Getting statistics difference
4. Starting query from first test
5. Fetch 10 rows
6. Getting statistics difference
7. Fetch next 10 rows
8. Getting statistics difference
9. Fetch next 10 rows
10. Getting statistics difference
And after executing this block, i want to check statistics.

Full script:

set feed off;

-- saving previous values
column st_dbtime      new_value prev_dbtime      noprint;
column st_cpu_time    new_value prev_cputime     noprint;
column st_user_calls  new_value prev_user_calls  noprint;
column st_recur_calls new_value prev_recur_calls noprint;

select   max(decode(sn.NAME,'DB time'                  ,st.value))*10 st_dbtime
        ,max(decode(sn.NAME,'CPU used by this session' ,st.value))*10 st_cpu_time
        ,max(decode(sn.NAME,'user calls'               ,st.value))    st_user_calls
        ,max(decode(sn.NAME,'recursive calls'          ,st.value))    st_recur_calls
from v$mystat st, v$statname sn
where st.statistic#=sn.statistic# 
  and sn.name in ('DB time','CPU used by this session'
                 ,'user calls','recursive calls'
                 )
/
-- variable for output from pl/sql block: 
var output varchar2(4000);

prompt Executing test...;
----- main test:
declare
   cnt int;
   st_dbtime      number; 
   st_cpu_time    number; 
   st_user_calls  number; 
   st_recur_calls number; 
   cursor c is 
      with gen as (select/*+ materialize */
                     level n, lpad(level,400) padding
                   from dual
                   connect by level<=200)
      select
          rownum rn
        , (select count(*) from gen g1, gen g2, gen g3 where g1.n>g2.n and g1.n*0=main.n*0) cnt
      from gen main
      where rownum<=60;
   
   type ctype is table of c%rowtype;
   c_array ctype;
   
   procedure SnapStats(descr varchar2:=null)
   is
      st_new_dbtime      number;
      st_new_cpu_time    number;
      st_new_user_calls  number;
      st_new_recur_calls number;
   begin
      select   max(decode(sn.NAME,'DB time'                 ,st.value))*10 st_dbtime
              ,max(decode(sn.NAME,'CPU used by this session',st.value))*10 st_cpu_time
              ,max(decode(sn.NAME,'user calls'              ,st.value))    st_user_calls
              ,max(decode(sn.NAME,'recursive calls'         ,st.value))    st_recur_calls
          into st_new_dbtime,st_new_cpu_time,st_new_user_calls,st_new_recur_calls
      from v$mystat st, v$statname sn
      where st.statistic#=sn.statistic#
        and sn.name in ('DB time','CPU used by this session'
                       ,'user calls','recursive calls'
                       );
      if descr is not null then
         :output:= :output || descr ||':'||chr(10)
                || 'sesstat dbtime:     ' || (st_new_dbtime      - st_dbtime      )||chr(10)
                || 'sesstat cputime:    ' || (st_new_cpu_time    - st_cpu_time    )||chr(10)
                || 'sesstat user calls: ' || (st_new_user_calls  - st_user_calls  )||chr(10)
                || 'sesstat recur calls:' || (st_new_recur_calls - st_recur_calls )||chr(10)
                || '======================================'||chr(10);
      end if;
      st_dbtime      := st_new_dbtime     ;
      st_cpu_time    := st_new_cpu_time   ;
      st_user_calls  := st_new_user_calls ;
      st_recur_calls := st_new_recur_calls;
   end;
   
begin
   -- saving previous stats:
   SnapStats;

   -- generating cpu load:
   for i in 1..1e7 loop
      cnt:=cnt**2+cnt**1.3-cnt**1.2;
   end loop;
   -- getting new stats:
   SnapStats('After pl/sql loop');
   
   open c;
   SnapStats('After "open c"');
   fetch c bulk collect into c_array limit 10;
   SnapStats('After fetch 10 rows');
   fetch c bulk collect into c_array limit 10;
   SnapStats('After fetch 20 rows');
   fetch c bulk collect into c_array limit 10;
   SnapStats('After fetch 30 rows');
   close c;
   SnapStats('After close c');
end;
/ 

prompt 'Delta stats after statement(ms):';
select   max(decode(sn.NAME,'DB time'                 ,st.value))*10
          - &&prev_dbtime      as delta_dbtime
        ,max(decode(sn.NAME,'CPU used by this session',st.value))*10
          - &&prev_cputime     as delta_cpu_time
        ,max(decode(sn.NAME,'user calls'              ,st.value))  
          - &&prev_user_calls  as delta_user_calls
        ,max(decode(sn.NAME,'recursive calls'         ,st.value))  
          - &&prev_recur_calls as delta_recur_calls
from v$mystat st, v$statname sn
where st.statistic#=sn.statistic# 
  and sn.name in ('DB time','CPU used by this session'
                 ,'user calls','recursive calls'
                 )
/
prompt 'Test results:';
col output format a40;
print output;
set feed off;

Output:

SQL> @tests/dbtime2

Executing test...
'Delta stats after statement(ms):'

DELTA_DBTIME DELTA_CPU_TIME DELTA_USER_CALLS DELTA_RECUR_CALLS
------------ -------------- ---------------- -----------------
       18530          18460                5                33

Test results:
OUTPUT
----------------------------------------
After pl/sql loop:
sesstat dbtime:     0
sesstat cputime:    4350
sesstat user calls: 0
sesstat recur calls:2
======================================
After "open c":
sesstat dbtime:     0
sesstat cputime:    20
sesstat user calls: 0
sesstat recur calls:4
======================================
After fetch 10 rows:
sesstat dbtime:     0
sesstat cputime:    4680
sesstat user calls: 0
sesstat recur calls:2
======================================
After fetch 20 rows:
sesstat dbtime:     0
sesstat cputime:    4680
sesstat user calls: 0
sesstat recur calls:2
======================================
After fetch 30 rows:
sesstat dbtime:     0
sesstat cputime:    4690
sesstat user calls: 0
sesstat recur calls:2
======================================
After close c:
sesstat dbtime:     0
sesstat cputime:    0
sesstat user calls: 0
sesstat recur calls:3
======================================

We can notice that “CPU time” is updated at the same time as recursive calls, but “DB time” is updated only with “User calls”. Although this difference is not so important(because in most cases we can use other statistics in sum), but i think, if you want to instrument some code, it gives reason to check out desirable statistics for update time.

oracle pl/sql v$mystat v$sesstat

A couple of well-known but often forgotten things for PL/SQL developers

Posted on May 28, 2013 by Sayan Malakshinov Posted in oracle, PL/SQL, troubleshooting 3,607 Page views 2 Comments

1. Don’t forget always add NO_DATA_FOUND exception handling, when you doing “select into” in code which can be called as from PL/SQL, as from SQL.

A little example:
Suppose we need to create a function, which would call some procedure:

create or replace procedure p_nested as
  a int;
begin
  select 1 into a from dual where 1=0;
end;
/
create or replace function f_no_data_found return varchar2 as
begin
  p_nested;
  return 'ok';
end;
/

When we call this function in PL/SQL, it will raise NO_DATA_FOUND and we will see it:

SQL> exec dbms_output.put_line(f_no_data_found);
BEGIN dbms_output.put_line(f_no_data_found); END;

*
ERROR at line 1:
ORA-01403: no data found
ORA-06512: at "XTENDER.P_NESTED", line 4
ORA-06512: at "XTENDER.F_NO_DATA_FOUND", line 3
ORA-06512: at line 1

But it doesn’t when we call it in SQL, because it’s normal for SQL: it’s just like a result of scalar subquery that returns nothing – NULL:

SQL> set null "NUL"
SQL> col ndf format a10
SQL> select f_no_data_found ndf from dual;

NDF
----------
NUL

1 row selected.

So if you want the function to behave the same way in PL/SQL and SQL, just add exception handling with reraising another exception or just return null.
It must be at the level of reflexes – “select into” → “exception when no_data_found”
Otherwise, later, when code become a big and difficult, you can get unstable hidden error.

2. Exceptions raised in a declaration section or in default parameters assigning will never be handled in exception section of the same level

Let’s take a look at a very simple example:

An example of exception in default parameter assigning

[sourcecode language=”sql”]
SQL> create or replace function f_value_error return int is
2 begin
3 raise value_error;
4 return 1;
5 end;
6 /

Function created.

SQL> create or replace function f(i int:=f_value_error) return varchar2 is
2 begin
3 return ‘ok’;
4 exception when others then
5 return dbms_utility.format_error_backtrace;
6 end;
7 /

Function created.

SQL> set serverout on;
SQL> begin
2 dbms_output.put_line(‘From f: ‘||chr(10)||f);
3 dbms_output.put_line(‘****************************’);
4 exception when others then
5 dbms_output.put_line(‘****************************’);
6 dbms_output.put_line(‘From higher level:’||chr(10)||dbms_utility.format_error_backtrace);
7 dbms_output.put_line(‘****************************’);
8 end;
9 /
****************************
From higher level:
ORA-06512: at "XTENDER.F_VALUE_ERROR", line 3
ORA-06512: at line 2

****************************

PL/SQL procedure successfully completed.
[/sourcecode]

[collapse]

As you can see, there are two problems:
1. an exception was handled at higher level
2. the error backtrace does not show the call of the function “F”.

If the exception was caused in the declaration, we would see the “correct” backtrace, but exception would be still handled at higher level only:

In the declaration

[sourcecode language=”sql” highlight=”25″]
SQL> create or replace function f(i int:=null) return varchar2 is
2 l_i int:=nvl(i,f_value_error);
3 begin
4 return ‘ok’;
5 exception when others then
6 return dbms_utility.format_error_backtrace;
7 end;
8 /

Function created.

SQL> set serverout on;
SQL> begin
2 dbms_output.put_line(‘From f: ‘||chr(10)||f);
3 dbms_output.put_line(‘****************************’);
4 exception when others then
5 dbms_output.put_line(‘****************************’);
6 dbms_output.put_line(‘From higher level:’||chr(10)||dbms_utility.format_error_backtrace);
7 dbms_output.put_line(‘****************************’);
8 end;
9 /
****************************
From higher level:
ORA-06512: at "XTENDER.F_VALUE_ERROR", line 3
ORA-06512: at "XTENDER.F", line 2
ORA-06512: at line 2

****************************

PL/SQL procedure successfully completed.
[/sourcecode]

[collapse]

Sometimes it’s not so dangerous, but last week I was investigating a complex case for this reason: one function when called in SQL throws strange exception, but in PL/SQL it works fine.
The exception was:

SQL> select PKG1.F(1,0,0,1275) from dual; 
select PKG1.F(1,0,0,1275) from dual 
       * 
ERROR at line 1: 
ORA-06553: PLS-801: internal error [1401]

And the function has many functions calls in default parameters initialization, so I couldn’t even find out which one contains a root problem.

oracle pl/sql troubleshooting
photo Sayan Malakshinov

Oracle ACE Pro Oracle ACE Pro Alumni

DEVVYOracle Database Developer Choice Award winner

Oracle performance tuning expert

UK / Cambridge

LinkedIn   Twitter
sayan@orasql.org

Recent Posts

  • Oracle Telegram Bot
  • Partition Pruning and Global Indexes
  • Interval Search: Part 4. Dynamic Range Segmentation – interval quantization
  • Interval Search Series: Simplified, Advanced, and Custom Solutions
  • Interval Search: Part 3. Dynamic Range Segmentation – Custom Domain Index

Popular posts

Recent Comments

  • Oracle SQL | Interval Search: Part 4. Dynamic Range Segmentation – interval quantization on Interval Search: Part 3. Dynamic Range Segmentation – Custom Domain Index
  • Oracle SQL | Interval Search: Part 4. Dynamic Range Segmentation – interval quantization on Interval Search: Part 2. Dynamic Range Segmentation – Simplified
  • Oracle SQL | Interval Search: Part 4. Dynamic Range Segmentation – interval quantization on Interval Search: Optimizing Date Range Queries – Part 1
  • Oracle SQL | Interval Search Series: Simplified, Advanced, and Custom Solutions on Interval Search: Part 2. Dynamic Range Segmentation – Simplified
  • Oracle SQL | Interval Search: Part 2. Dynamic Range Segmentation – Simplified on Interval Search: Part 3. Dynamic Range Segmentation – Custom Domain Index

Blogroll

  • Alex Fatkulin
  • Alexander Anokhin
  • Andrey Nikolaev
  • Charles Hooper
  • Christian Antognini
  • Coskan Gundogar
  • David Fitzjarrell
  • Igor Usoltsev
  • Jonathan Lewis
  • Karl Arao
  • Mark Bobak
  • Martin Bach
  • Martin Berger
  • Neil Chandler
  • Randolf Geist
  • Richard Foote
  • Riyaj Shamsudeen
  • Tanel Poder
  • Timur Akhmadeev
  • Valentin Nikotin
  • Prev
  • 1
  • 2
  • 3
©Sayan Malakshinov. Oracle SQL