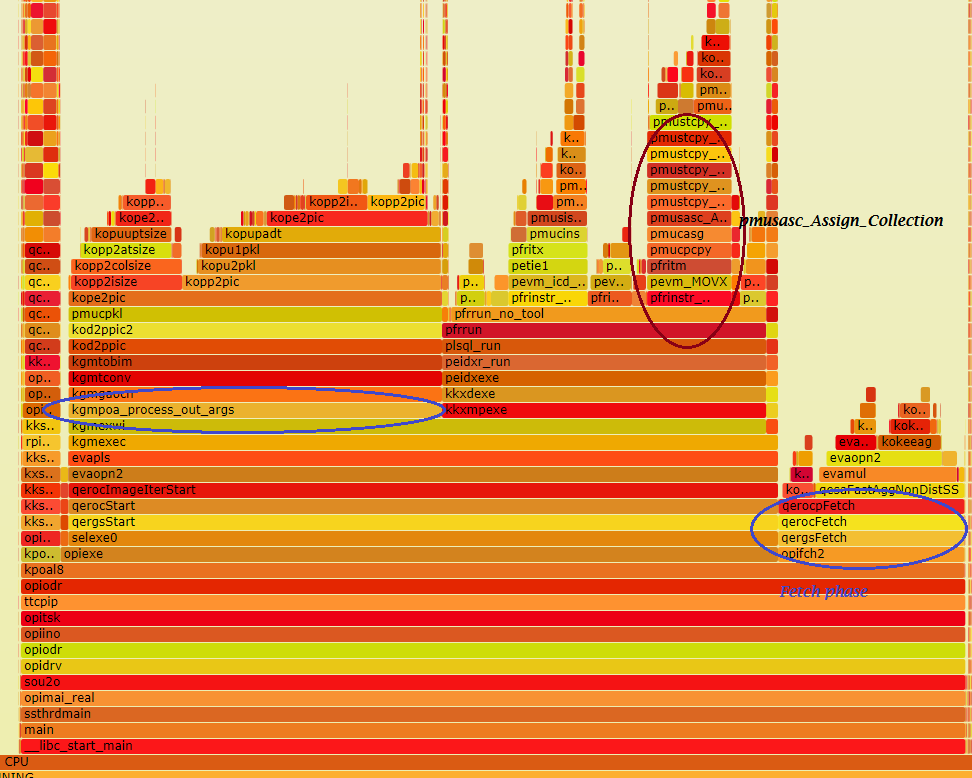
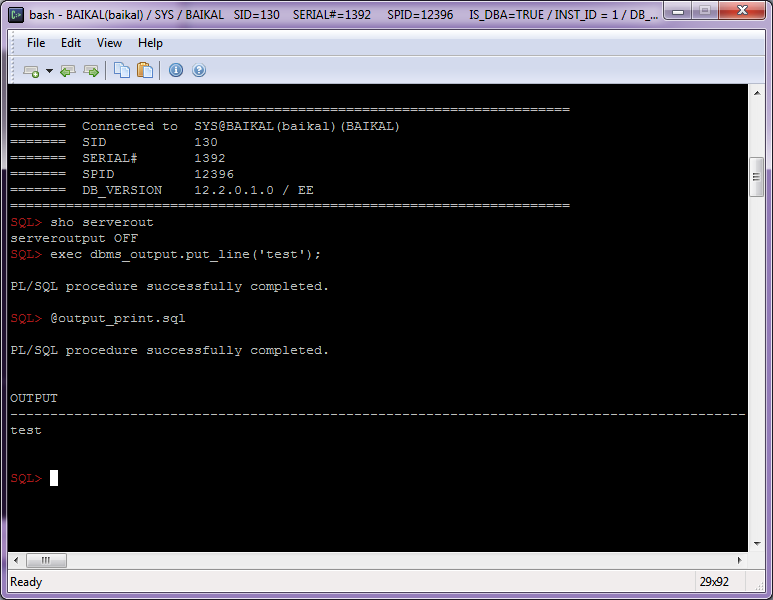
Sometimes it’s really hard even to create reproducible test case to send it to oracle support, especially in case of intermittent errors.
In such cases, I think it would be really great to have access to similar service requests or bugs of other oracle clients.
So while my poll about knowledge sharing is still active, I want to share a couple of bugs we have faced after upgrade to 12.2 (and one bug from Eric van Roon). I’m going to remove the bugs from this list when they become “public” or “fixed”.
If you want to add own findings into this list, you can add them into comments. To make this process easier, you can provide just symptomps, short description and the link to own post with details – I’ll add it just as a link.
Continue reading
Tag Archives: oracle
Revisiting buffer cache Very Large Object Threshold
If you turn on NSMTIO tracing you will see references to VLOT:
qertbFetch:[MTT < OBJECT_SIZE < VLOT]: Checking cost to read from caches (local/remote) and checking storage reduction factors (OLTP/EHCC Comp)
I had said you could ignore VLOT and Frits Hoogland pointed out that tracing showed it had some impact, so let me clarify:
VLOT is the absolute upper bound that cached reads can even be considered.
This defaults to 500% of the number of buffers in the cache i.e.
_very_large_object_threshold = 500
While this number is not used in any calculations, it is used in two places as a cutoff to consider those calculations
1) Can we consider using Automatic Big Table Caching (a.k.a. DWSCAN) for this object?
2) Should we do a cost analysis for Buffer Cache scan vs Direct Read scan on tables larger than the MTT?
The logic for tables above the calculated medium table threshold (MTT) and that are NOT part of searched DMLs and are NOT on Exadata with statistics based storage reduction factor enabled (_statistics_based_srf_enabled) is:
- If _serial_direct_read == ALWAYS, use Direct Read
- If _serial_direct_read == NEVER, use Buffer Cache
- If _serial_direct_read == AUTO and #blocks in table < VLOT, use cost model
- Else use Direct Read “qertbFetch:DirectRead:[OBJECT_SIZE>VLOT]”
In practice 5X buffer cache is so large the cost based decision will come to the same conclusion anyway – the default VLOT simply saves time spent doing the analysis.
For example, I got a quick count of the number of blocks in non-partitioned TPC_H Scale 1 lineitem
select segment_name,sum(blocks),sum(bytes) from user_extents where segment_name='LINEITEM'
and created my buffer cache to be exactly the same size. With this setup, setting _very_large_object_threshold=100
bypassed the cost model and went straight to DR scan, while setting it to 200 forced the use of the cost model.
The moral of this is that the default value of VLOT rarely changes the decisions made unless you reduce VLOT to a much smaller multiplier of the cache size and can start to see it cause a few more of your larger buffer cache scans move to direct read when they are no longer eligible for cost analysis. If you wish to stop some of the largest buffer cache scans from happening you would need to set _very_large_object_threshold
less than 200.
Random thoughts on block sizes
I heard “Oracle only tests on 8k and doesn’t really test 16k”
I heard someone assert that one reason you should only use 8k block sizes is that, and I quote, “Oracle only tests on 8k and doesn’t really test 16k”. I tried googling that rumour and tracked it back to AskTom. Also as disks and memory get bigger and CPUs get faster it is natural to ask if 8k is now “too small”.
So here are my thoughts:
1. A quick scan of the data layer regression tests showed a very large number running on 16k blocks
2. Oracle typically runs it DW stress tests on 16k blocks
So, clearly, the assertion is untrue but I did spot some areas where 32k testing could be improved. I also added a note to AskTom clarifying testing on 16k.
Does this mean I should look at using 16k blocks for me DW
Whoa, not so fast. Just because table scans typically run slightly faster on 16k blocks and compression algorithms typically get slightly better compression on 16k blocks does not mean your application will see improvements
1. Multiple block sizes mean added work for the DBA
2. Databases do a lot more than just scan tables – e.g. row based writes and reads could perform worse
3. Most apps have low hanging fruit that will give you far better ROI on your time than worrying about block sizes (if you don’t believe me, attend one of Jonathan Lewis’s excellent index talks).
Most applications run fine on 8k because it is a good trade off between different access paths and, in general, 8k is still the right choice for most applications.
What about ‘N’ row pieces
In general Oracle’s block layout tries to ensure row pieces are split on column boundaries but in the case of very wide columns we will split in the middle of a column if too much space would be wasted by aligning with column boundaries. When a column is split in the middle it creates what is known as an ‘N’ row piece.
Rows are split by default at 255 column boundaries assuming the row piece fits in the block If you have a table with very wide rows or some very wide inline columns, smaller block sizes will result both in rows being split more often and in columns being split in the middle. At a minimum the number of block gets to retrieve a single row will likely increase. This is one case to consider where a 16k block size may be worth investigating.
The curious case of 70X compression
We had case of a customer legitimately point out that ZLIB would give much better than 70X compression on his very repetitive data but COMPRESS FOR QUERY HIGH was stuck at 70X. And, as it turns out, this is a factor of block size.
Hybrid Columnar Compression (HCC) takes up to 8 MB of raw data and compresses it down to one CU (Compression Unit) subject to row limits depending on compression type. For example COMPRESS FOR ARCHIVE LOW (which is also ZLIB) is limited to 8,000 rows in a CU. But there is another limit which you may deduce from block dumps which is that HCC will only allow one head piece row per block because HCC rowids are the RDBA of the head piece plus the row offset into the CU. So if you have incredibly compressible data where 8,000 rows compress down to less 16k moving to a larger block size can be bad news because you will end up with wasted space at the end of each block.
Summary
There are typically better things to spend time on than worrying about block size but if you wish to run your DW on 16k blocks they are thoroughly tested just like 8k blocks are.
External Tables Part 1 – Project Columns All vs Referenced
I normally blog about table scans on Oracle native data but Oracle also supports a wide variety of features for scanning external tables and I need to cover these too. One of the ways I learn new things is being sent a bug report and saying to myself “Oh! I didn’t know you could do that”. So today I’m going to start with the grammar:
Alter Table <xt> Project Columns [ All | Referenced ]
Ampersand instead of colon for bind variables
I’ve troubleshooted one query today and I was very surprised that bind variables in this query were specified with &ersand instead of :colon! I have never seen this before and I couldn’t find anything about this in documentation…
Unfortunately SQL*Plus doesn’t support ampersand yet, even if you disable define (“set define off”),
so I’ve tested such behaviour with this code:
set def off serverout on exec declare s varchar2(1); begin execute immediate 'select 1 from dual where dummy=&var' into s using 'X'; dbms_output.put_line(s); end;
And it really works! //at least on 11.2.0.2 and 12.2.0.1
SQL> set def off serverout on SQL> exec declare s varchar2(1); begin execute immediate 'select 1 from dual where dummy=&var' into s using 'X'; dbms_output.put_line(s); end; 1 PL/SQL procedure successfully completed. SQL> select substr(sql_text,1,40) stext,sql_id,executions,rows_processed from v$sqlarea a where sql_text like '%dual%&var'; STEXT SQL_ID EXECUTIONS ROWS_PROCESSED ------------------------------------- ------------- ---------- -------------- select 1 from dual where dummy=&var ckkw4u3atxz02 3 3 SQL> select * from table(dbms_xplan.display_cursor('ckkw4u3atxz02')); PLAN_TABLE_OUTPUT -------------------------------------------------------------------------- SQL_ID ckkw4u3atxz02, child number 0 ------------------------------------- select 1 from dual where dummy=&var Plan hash value: 272002086 -------------------------------------------------------------------------- | Id | Operation | Name | Rows | Bytes | Cost (%CPU)| Time | -------------------------------------------------------------------------- | 0 | SELECT STATEMENT | | | | 2 (100)| | |* 1 | TABLE ACCESS FULL| DUAL | 1 | 2 | 2 (0)| 00:00:01 | -------------------------------------------------------------------------- Predicate Information (identified by operation id): --------------------------------------------------- 1 - filter("DUMMY"=:VAR) 18 rows selected.
Update: Btw, it works for SQL only, not for PL/SQL:
SQL> var v varchar2(1); SQL> begin &v = 'Z'; end; 2 / begin &v = 'Z'; end; * ERROR at line 1: ORA-06550: line 1, column 7: PLS-00103: Encountered the symbol "&" when expecting one of the following: SQL> exec &v := 'X'; BEGIN &v := 'X'; END; * ERROR at line 1: ORA-06550: line 1, column 7: PLS-00103: Encountered the symbol "&" when expecting one of the following: The symbol "&" was ignored.
SQL> exec :v := 'X'; PL/SQL procedure successfully completed. SQL> select * from dual where dummy=&v 2 ; D - X
And we can can use mixed placeholders:
SQL> select * from dual where dummy=&v and &v=:v; D - X
The beginners guide to Oracle Table Scans
I was asked a question yesterday that reminded me there are always people completely new to the topic who need an introduction – somewhere to start before the other articles make sense. So, here’s my brief write-up of everything you need to know about the basic of Oracle Table Scans.
Oracle has four main ways of scanning a table: the pre-9ir2 table scan, the 9ir2 TurboScan, the 11.1.0.1 Exadata SmartScan, and the 12.1.0.1 In-Memory Scan. Before we summarize each one, the other fundamental piece of information is the Oracle dictum that all blocks much be self-describing: a table scan routine should be able to inspect a block and understand what object it belongs, whether it needs an undo applying, and how the data is laid out without reference to any external structures or secondary storage.
The original table scan routine
Oracle uses a “dataflow” query engine which means a query plan is built from nodes like a sausage machine that have three basic operations: Open, Next, Close. ‘Open’ means you ask the next node in the chain to prepare to do some work including acquiring any resources it may need, ‘Next’ means you fetch one unit of work from your child e.g. a row, and ‘Close’ means to tell your child node to shut down and release any resources it may be holding. You build a query by connecting the right kinds of nodes together in the order you want: one node just sorts, another groups, another does hash joins. The end of the sausage machine is the node seen on query plans as “Table Access Full”
This node would ask the data layer to fetch a block from disk then get rows one at a time from the data layer. This is the work horse table scan: it can scan any kind of data and do SCN manipulations like row versions but it is not the fastest way to scan a table.
9ir2 TurboScan
In 9ir2 we introduced a much faster way of scanning tables called TurboScan. The data layer function which had been handing out rows one at a time was replaced by one that stays in a tight loop retrieving rows from disk and pushing them into a callback supplied by “Table Access Full”. An automation tool was used to generate several versions of this routine that optimized out common choices that has to be made: does the user need rowids to be projected? do they need predicates applying? is the data compressed or? is the data column-major or row-major? etc etc Every time a CPU reaches a branch in the code it tries to guess which side of the branch will be taken but if it guess wrong there can be a considerable stall during which no work gets done. By removing most of the branches, the code runs much much more quickly.
TurboScan is used for all queries which do not use RAW datatypes and which do not need special SCN processing.
Both pre-9ir2 scan and TurboScan can use the buffer cache to get blocks (typically small to medium tables) or use Direct Read to get blocks (typically medium to large tables).
See: When bloggers get it wrong – part 1
TurboScan can be disabled for triage purposes by setting:
SQL> alter session set events='12099 trace name context forever, level 1';
or specifically you can disable it only for HCC tables by setting:
SQL> alter session set "_arch_comp_dbg_scan"=1;
Exadata SmartScan
In 11.1.0.1 we introduced Exadata SmartScan intelligent storage. This is where a thin layer of database processing is embedded in the storage cells and the table scan routine offloads simple search criteria and a list of the columns it needs to storage and the storage cells pre-process the blocks to remove rows that fail the search criteria and remove columns which are not needed by the table scan. If all the rows are removed, the block doesn’t have to be sent back at all.
SmartScan can drastically reduce the amount of data returned on the Interconnect and put on the RDBMS memory bus and the space used in SGA by the returned data. An additional significant benefit is gained when the CPU fetches the reduced blocks into the CPU cache since only relevant information exists on the block there is not space wasted by unwanted columns interspersing the wanted columns meaning more relevant data can fit in memory and the CPU prefetch can do a better job of predicting which memory cache line to fetch next.
Only TurboScan Direct Read scans can use this offload capability. You can disable SmartScan for triage purposes by setting:
SQL> alter session set cell_offload_processing=FALSE;
or
SQL> select /*+ opt_param('cell_offload_processing','false') */ <col> from <tab> where <predicate>;
In-Memory Scans
In-Memory scans were introduced in 12.1.0.1 and brought a revolutionary increase in table scan speeds. With In-Memory scans the table or partition is loaded into a in-memory tablespace in SGA known as the inmemory-area. Data is stored in compressed columnar format typically up to 500,000 values in each columnar compression unit. This tablespace is kept transactionally consistent with the data on disk via means of an invalidation bitmap.
Just like with SmartScan, only TurboScan can use In-Memory scans with In-Memory objects. Instead of getting a block from disk, the specialized version of the scan routines fetches a column run from each column of interest, process the search criteria, then returns column runs with the failing rows removed to the “Table Access Full” node.
If any rows have been modified and committed by other users or the users own transaction has modified any rows the scan will see these rows set in the invalidation bitmap. These rows are removed from the columnar results and the additional rows required are fetched from the buffer cache before moving on to the next set of column runs. This works well because the most recently modified blocks are the ones most likely to still be in the buffer cache.
Working around heatbeat issues caused by tracing or by regexp
I had noted in my first post that using the highest level of tracing caused timeout issues with the offload server heartbeat monitor. Heartbeat issues can also occur with expensive (and badly formed) regexp expressions. By default the heartbeat monitor is set to 6 seconds which is the maximum permitted to process 1MB data in the offload server and mark the task completed and is far more time than is reasonably expected to take.
Operations such as expensive tracing to disk or badly formed regexp expressions that cause that time period to be exceeded lead to this in the alert log:
State dump signal delivered to CELLOFLSRV<10180> by pid - 9860, uid - 3318
Thu Mar 5 12:26:31 2015 561 msec State dump completed for CELLOFLSRV<10180>
Clean shutdown signal delivered to CELLOFLSRV<10180> by pid - 9860, uid - 3318
CELLOFLSRV <10180> is exiting with code 1
where the restart server bounces the offload server to clear the perceived hang. Increasing the timeout via:
CellCLI> alter cell events = "immediate cellsrv.cellsrv_setparam('_cell_oflsrv_heartbeat_timeout_sec','60')"
enables the tracing to proceed without causing the restart server.
My point in writing this entry was to provide a work-around when tracing is needed but also to address a couple of blog posts I’d seen that recommend leaving it set at 60 or 90 seconds. This is not a good idea. The heartbeat exists to catch genuine but rare issues and leaving this set to an increased value will hinder the offload server restarting quickly to resume work. This is one parameter that shoud be reset to the default when the work-around is no longer needed unless otherwise directed by support.
Roger MacNicol
Why you dont want to set _partition_large_extents FALSE
I’ve seen some blogs recommending that _partition_large_extents be set to FALSE for a variety of space conserving reasons without the authors thinking about the negative impact this is going to have on Smart Scan. Large Extents cause an INITIAL allocation of 8 MB and a NEXT allocation of 1 MB and they have been the default for table spaces on Exadata since 11.2.0.2. You can verify that large extents are in use by a given table or partition by:
Select segment_flags
From sys_dba_segs
where segment_name = <table_name>
and owner = <schema_name>;
The segment flag bit for large extents is 0x40000000.
This pattern of allocation is design to work optimally with Smart Scan because Smart Scan intrinsically works in 1 MB chunks. Reads of ASM allocation units are split into maximum 1 MB chunks to be passed to the filter processing library to have their blocks sliced and diced to create the synthetic blocks that contain only the rows and columns of interest to return to the table scan driver. When less than 1 MB gets allocated at a time to a segment and then the next contiguous blocks gets allocated to a different segment, each separate run of blocks will be read by a different MBR. Each run will be passed separately to Smart Scan and we get sub-optimal chunks to work on increasing both the overhead of processing and the number of round trips needed to process the table scan. The design of Smart Scan is predicated on scooping up contiguous runs of data from disk for efficient processing.
This matters particularly for HCC data and for chained rows.
Continue readingWhy are HCC stats being bumped when Smart Scanning row major data in 12.2
In 12.2, there is a stat “cell blocks pivoted” that points to a new optimization. When Smart Scan processes data, it has to create a new synthetic block that only contains the columns that are needed and the rows that pass the offloaded predicates.
If Smart Scan has to create a new block, why would you create a new row-major block when we can just as easily create uncompressed HCC block? It is roughly the same amount of work but once the synthetic block is returned to the RDBMS for processing, columnar data is 10X cheaper to process when the query uses rowsets. SO where does the name of this stat come from? Simple, it works just like a spreadsheet PIVOT operation, swapping rows for columns.
So what is a “rowset”? It simply means that a step in a query plan will take in a set of rows before processing and then process that entire batch of rows in one go before fetching more rows; this is significantly more efficient than processing one row at a time. You can see when a query uses rowsets via:
select * from table(dbms_xplan.display_cursor('<sql_id>',1,'-note +projection'));
in which case you will see projection metadata with details such as “(rowsets=200)”.
When Smart Scan sees that the query on the RDBMS is using rowsets, it tries to create a columnar output block instead of a row-major output block and when this arrives on the RDBMS, the table scan will see an HCC block and bump the HCC stats even though the table being scanned doesn’t use HCC. Let’s see how this works in practice:
Continue readingUsing INMEMORY with External Tables
Several people have asked if there is any way to use INMEMORY on External Tables because the INMEMORY syntax is not supported in Create Table and Alter Table with Organization External (actually Create Table parses it but then ignores it).
While there is no way out of having to load the data into Oracle 12.1.0.2, there is a short cut to simplify life when you have an external process recreating flat file data on a regular basis and want to query the latest incarnation against corporate data in Oracle Tablespaces. One example we’ve seen of this is where you have a map-reduce job on Hadoop that highly summarizes large amounts of ephemeral data and it is the summary data that needs to be joined against Oracle data.
Instead of truncating the Oracle table and doing a flat file load each time, we can use a Materialized View on the external table and simply issue an on-demand refresh and let the materialized view take care of the truncate and load under the covers for us.
Since INMEMORY does support Materialized Views, we can now automatically get INMEMORY query speeds on the data from an external source.
Let’s see how this works. For example here’s a loader table I use with TPC-H Scale 1 for local testing:
Continue reading