
Oracle 12c introduced Partial indexing, which works well for simple partitioned tables with literals. However, it has several significant issues:
Continue readingCategory Archives: trace
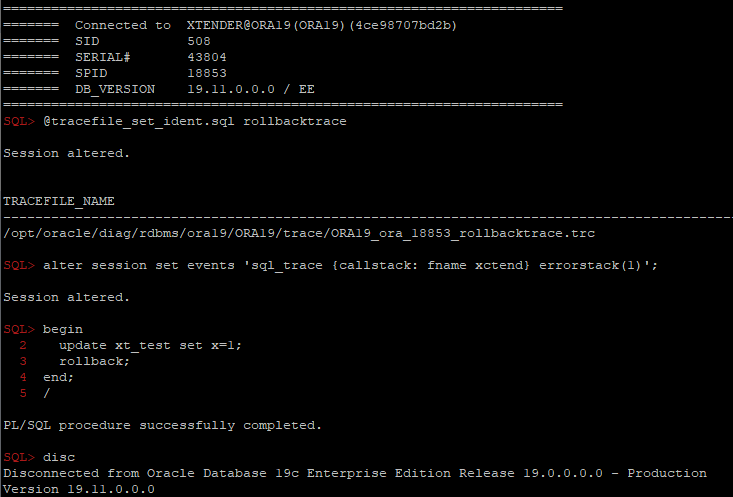
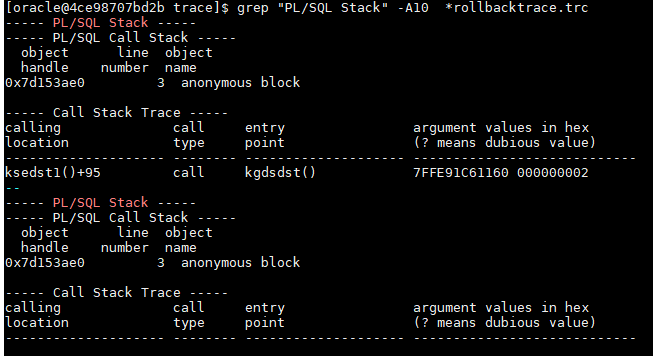
Where does the commit or rollback happen in PL/SQL code?
One of the easiest ways is to use diagnostic events:
alter session set events 'sql_trace {callstack: fname xctend} errorstack(1)';
Another interesting troubleshooting case
Got an interesting question today in RuOUG:
Some very simple PL/SQL procedures usually are completed within ~50ms, but sometimes sporadically longer than a second. For example, the easiest one from these procedures:
create or replace PROCEDURE XXXX (
  P_ORG_NUM IN number,
  p_result OUT varchar2,
  p_seq OUT number
) AS
BEGIN
  p_seq := P_ORG_NUM; p_result:='';
END;
sql_trace shows that it was executed for 1.001sec and all the time was “ON CPU”:
Continue readingSQL*Plus tips #9: Reading traces and incident files
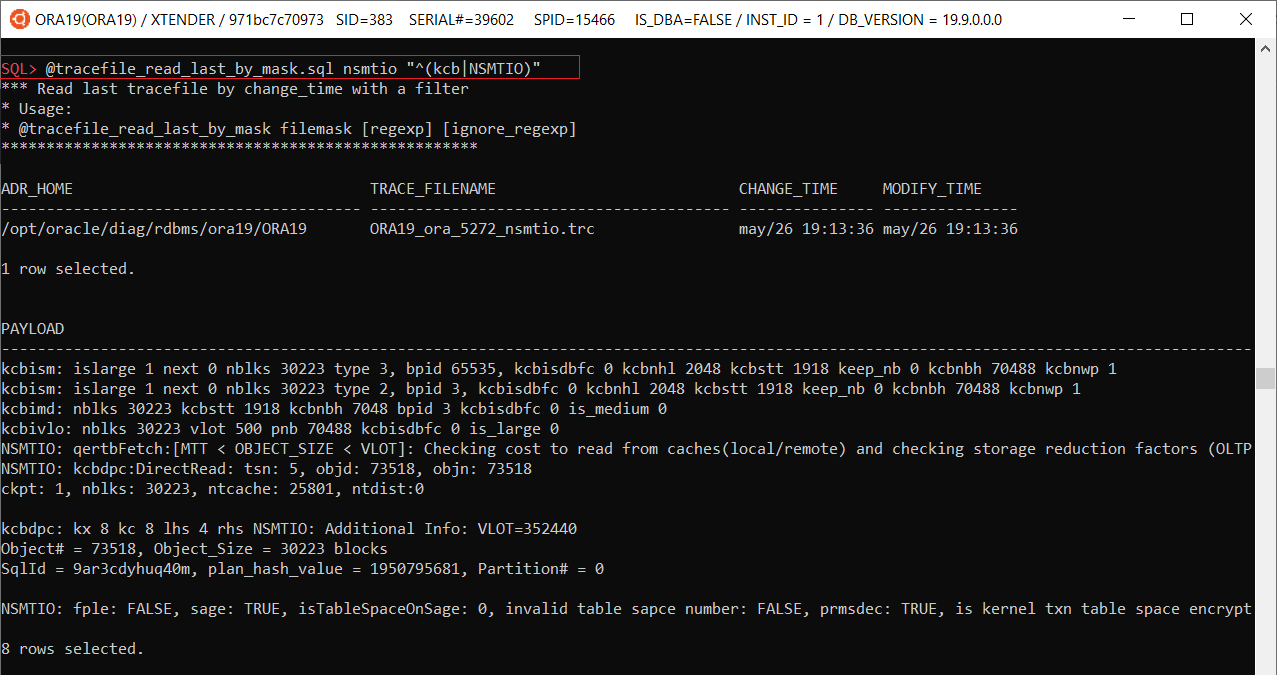
@tracefile_read_last_by_mask filemask [regexp] [ignore_regexp]
– finds last trace by filemask and filters rows by regexp and filters out rows by ignore_regexp:
@ tracefile_by_mask.sql [mask] – finds and shows last 10 trace files by mask
Continue readingOracle diagnostic events — Cheat sheet
Oracle diagnostic events is a great feature, but unfortunately poorly documented and nonintuitive, so it’s difficult to remember all events/actions/parameters and even read its internal documentation using oradebug. So I decided to compile its internal doc as a more convenient html-version (https://orasql.org/files/events/) and make a cheat sheet of some unknown or little-known use cases.
Example 1:
alter system set events
   'kg_event[1476]
        {occurence: start_after 1, end_after 3}
            trace("stack is: %\n", shortstack())
            errorstack(2)
    ';
- kg_event[errno] – Kernel Generic event in library Generic for error number events, which instructs to trace ORA-errno errors;
- {occurence: start_after X, end_after Y} – is a filter, which instructs to skip X event checks and trace just Y times;
- trace(format, str1, str2, …, str15) – is a function from ACTIONS for printing into a trace file;
- shortstack() – is a function from ACTIONS , which returns a short call stack as a string;
- errorstack(level) – is a function from ACTIONS, which prints extended info (level: 0 – errorstack only, 1 – errorstack + call stack, 2 – as level 1 + processtate, 3 – as level 2 + context area). You can get more details with PROCESSSTATE or SYSTEMSTATE. If you need just a call stack, you can use CALLSTACK(level) , with function arguments in case of level>1.
Example 2:
alter system set events
    'trace[SQL_Compiler.* | SQL_Execution.*]
        [SQL: ...]
            {process: ospid = ...}
            {occurence:end_after 3}
                controlc_signal()';
Triaging Smart Scan
This document is my attempt to bring together the available options that can be used to determine the root cause of an issue in order to create a roadmap to help support engineers narrow down the cause of concern.
It is a living document and will be edited and amended as time goes by. Please do check back again in the future.
Warning: these parameters should only be used in conjunction with an Oracle Support Engineer and are not intended for DBAs to self-triage; also they should not be left set after triage without discussion with an Oracle Support Engineer.
Continue readingSmart Scan and Recursive queries
Since Christmas I have been asked to investigate two different “failures to use Smart Scan”. It turns out they both fell into the same little known restriction on the use of Direct Read. Smart Scan critically depends on Direct Read in order to read the synthetic output blocks into private buffers in PGA so with Direct Read disabled Smart Scan is also disabled. In these two cases the restriction is on using Direct Read on Serial Recursive queries.
Case 1: Materialized View Refresh
A customer asked me to investigate why his MView refresh was running slowly and was failing to use Smart Scan. He had used 'trace[NSMTIO] disk=highest' which showed the cause as:
Direct Read for serial qry: disabled(::recursive_call::kctfsage:::)
Reading and analyzing trace file contents using just SQL
Simple example: tracefiles for the last 5 days:
select fc.*
from v$diag_trace_file f
     join v$diag_trace_file_contents fc
          on f.adr_home=fc.adr_home
          and f.trace_filename=fc.trace_filename
where f.modify_time >= systimestamp - interval'5' minute
  and fc.timestamp  >= systimestamp - interval'5' minute
  and fc.component_name = 'SQL_Trace'
  --and fc.section_name like 'kests%'
  ;
--or:
select tr.*
  from v$diag_app_trace_file tf,
       v$diag_sql_trace_records tr
 where tf.sql_trace = 'Y'
   and tf.modify_time > systimestamp - interval'5'minute
   and tr.adr_home = tf.adr_home
   and tr.trace_filename = tf.trace_filename
   and tr.timestamp > systimestamp - interval'5'minute;
Correct syntax for the table_stats hint
A friend contacted me to ask why they were having problems using the table_stats hint to influence optimizer decision making and also to influence the decision to use direct read or buffer cache scan so this is just a quick blog post to clarify the syntax as it is not well documented.
table_stats(<table_name> <method> {<keyword>=<value>} )

Method is one of: DEFAULT, SET, SCALE, SAMPLE

Keyword is one of: BLOCKS, ROWS, ROW_LENGTH
Shining some light on Database In-Memory vs the Exadata Columnar Cache in 12.1.0.2
I posted a while back on how to use Tracing Hybrid Columnar Compression in an offload server so this is a quick follow up.
- I have trouble remembering the syntax for setting a regular parameter in an offload server without bouncing it. Since I need to keep this written down somewhere I thought it might be use to support folks and dbas.
- I forgot to show you how to specify which offload group to set the trace event
So this example should do both:
CellCLI > alter cell offloadGroupEvents = "immediate cellsrv.cellsrv_setparam('my_parameter, 'TRUE')", offloadGroupName = "SYS_122110_160621"
this will, of course, set a parameter temporarily until the next time the offload server is bounced, but also adding it to the offload group’s init.ora will take care of that.